

Phytoplankton
97
biomass (Sukhanova 1983) an adequate values could be obtained perhaps
only by a combination of the above-mentioned reverse Nuclepore filtration
with the direct epifluorescence counts of 0.4-11 black Nuclepore filters. But
such estimations are still rare (Orlova 1985; Kopylov and Orlova 1985). The
chlorophyll quantifications are more informative than the number of cells.
But using the clorophyll content in water for calculations of phytoplankton
biomass or production may given only some indefinite approximations
because its content in cells as well as the assimilation numbers of photosynthesis may vary by an order of values, especially in reefal phytoplankton,
composed largely of benthic and pseudoplanktonic elements, which might
be rich in chlorophyll but functionally inactive.
The first measurements of primary photosynthesis production in lagoons
of some Pacific atolls resulted in very low numbers: 0.5-2mgCm- 3 day-l
(Sargent and Austin 1949). In fact, its rates in lagoons of many atolls may be
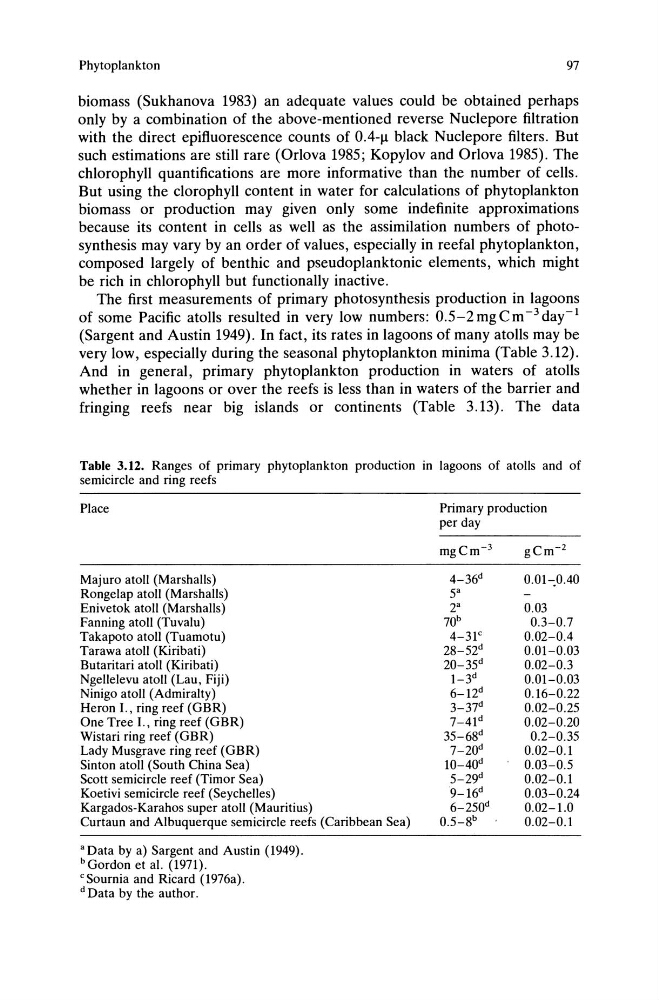
very low, especially during the seasonal phytoplankton minima (Table 3.12).
And in general, primary phytoplankton production in waters of atolls
whether in lagoons or over the reefs is less than in waters of the barrier and
fringing reefs near big islands or continents (Table 3.13). The data
Table 3.12. Ranges of primary phytoplankton production in lagoons of atolls and of
semicircle and ring reefs
Place
Majuro atoll (Marshalls)
Rongelap atoll (Marshalls)
Enivetok atoll (Marshalls)
Fanning atoll (Tuvalu)
Takapoto atoll (Tuamotu)
Tarawa atoll (Kiribati)
Butaritari atoll (Kiribati)
Ngellelevu atoll (Lau, Fiji)
Ninigo atoll (Admiralty)
Heron I., ring reef (GBR)
One Tree I., ring reef (GBR)
Wistari ring reef (GBR)
Lady Musgrave ring reef (GBR)
Sinton atoll (South China Sea)
Scott semicircle reef (Timor Sea)
Koetivi semicircle reef (Seychelles)
Kargados-Karahos super atoll (Mauritius)
Curtaun and Albuquerque semicircle reefs (Caribbean Sea)
a Data by a) Sargent and Austin (1949).
b Gordon et al. (1971).
c Sournia and Ricard (1976a).
d Data by the author.
Primary production
per day
4-36 d
5 a
2 a
70 b
4-31c
2S-52d
20-35 d
I-3 d
6-12d
3-37 d
7-41d
35-6S d
7-20d
1O-40d
5-29 d
9-16 d
6-250 d
0.5-S b
0.01-:0.40
0.03
0.3-0.7
0.02-0.4
0.01-0.03
0.02-0.3
0.01-0.03
0.16-0.22
0.02-0.25
0.02-0.20
0.2-0.35
0.02-0.1
0.03-0.5
0.02-0.1
0.03-0.24
0.02-1.0
0.02-0.1
97
biomass (Sukhanova 1983) an adequate values could be obtained perhaps
only by a combination of the above-mentioned reverse Nuclepore filtration
with the direct epifluorescence counts of 0.4-11 black Nuclepore filters. But
such estimations are still rare (Orlova 1985; Kopylov and Orlova 1985). The
chlorophyll quantifications are more informative than the number of cells.
But using the clorophyll content in water for calculations of phytoplankton
biomass or production may given only some indefinite approximations
because its content in cells as well as the assimilation numbers of photosynthesis may vary by an order of values, especially in reefal phytoplankton,
composed largely of benthic and pseudoplanktonic elements, which might
be rich in chlorophyll but functionally inactive.
The first measurements of primary photosynthesis production in lagoons
of some Pacific atolls resulted in very low numbers: 0.5-2mgCm- 3 day-l
(Sargent and Austin 1949). In fact, its rates in lagoons of many atolls may be
very low, especially during the seasonal phytoplankton minima (Table 3.12).
And in general, primary phytoplankton production in waters of atolls
whether in lagoons or over the reefs is less than in waters of the barrier and
fringing reefs near big islands or continents (Table 3.13). The data
Table 3.12. Ranges of primary phytoplankton production in lagoons of atolls and of
semicircle and ring reefs
Place
Majuro atoll (Marshalls)
Rongelap atoll (Marshalls)
Enivetok atoll (Marshalls)
Fanning atoll (Tuvalu)
Takapoto atoll (Tuamotu)
Tarawa atoll (Kiribati)
Butaritari atoll (Kiribati)
Ngellelevu atoll (Lau, Fiji)
Ninigo atoll (Admiralty)
Heron I., ring reef (GBR)
One Tree I., ring reef (GBR)
Wistari ring reef (GBR)
Lady Musgrave ring reef (GBR)
Sinton atoll (South China Sea)
Scott semicircle reef (Timor Sea)
Koetivi semicircle reef (Seychelles)
Kargados-Karahos super atoll (Mauritius)
Curtaun and Albuquerque semicircle reefs (Caribbean Sea)
a Data by a) Sargent and Austin (1949).
b Gordon et al. (1971).
c Sournia and Ricard (1976a).
d Data by the author.
Primary production
per day
4-36 d
5 a
2 a
70 b
4-31c
2S-52d
20-35 d
I-3 d
6-12d
3-37 d
7-41d
35-6S d
7-20d
1O-40d
5-29 d
9-16 d
6-250 d
0.5-S b
0.01-:0.40
0.03
0.3-0.7
0.02-0.4
0.01-0.03
0.02-0.3
0.01-0.03
0.16-0.22
0.02-0.25
0.02-0.20
0.2-0.35
0.02-0.1
0.03-0.5
0.02-0.1
0.03-0.24
0.02-1.0
0.02-0.1