

V
VULNERABILITY INDEX
Aysun Koroglu
Coastal Sciences and Civil Engineering Department,
Istanbul Technical University, Maslak, Istanbul, Turkey
Synonyms
Contingency index; Susceptibility index
Definition
A vulnerability index (VI) is a tool to magnify or measure
the effects of any potential hazard (natural or humaninduced environmental, social, or economic hazard/risk)
where a population or region is exposed. The first formal
VI was proposed by the Maltese Ambassador to the
United Nations in 1990. The basics of a VI were described
by researcher Lino Briguglio of the University of Malta.
The index was formalized by the ratio between the quantitative components to the relative importance and the
cumulative score of the weighted values (Sullivan, 2008).
Description
A VI can be generated to define vulnerability of coastal
areas or ecosystems (e.g., estuaries, lagoons, coastal wetlands) to sea-level rise, climate change, floods, oil spills,
erosion, etc. This phenomenon is called the coastal vulnerability index (CVI). Indicators selected from ecological,
social, or economic components can be used to understand
vulnerability of coastal systems to a certain exposure.
Guannel and Verutes (2012) used a model in order to
achieve qualitative assessment of vulnerability (varying
from very low, rocky cliffs to very high deltas) based on
the mixture of relative and absolute ranking of variables
(e.g., geomorphology, relief, natural habitats, sea-level
change, wind exposure, surge potential).
In order to apply a VI to a specific coastal area, the
distribution of coastal environments (e.g., sandy beaches,
dunes, lagoons, coastal wetlands, estuaries, rocky cliffs)
must first be mapped and classified in terms of potential
vulnerability to a specific hazard (Doukakis, 2005).
A CVI is an effective tool to emphasize areas where
vulnerability to any hazard may be the greatest. Once each
section of coastline is assigned a vulnerability value for
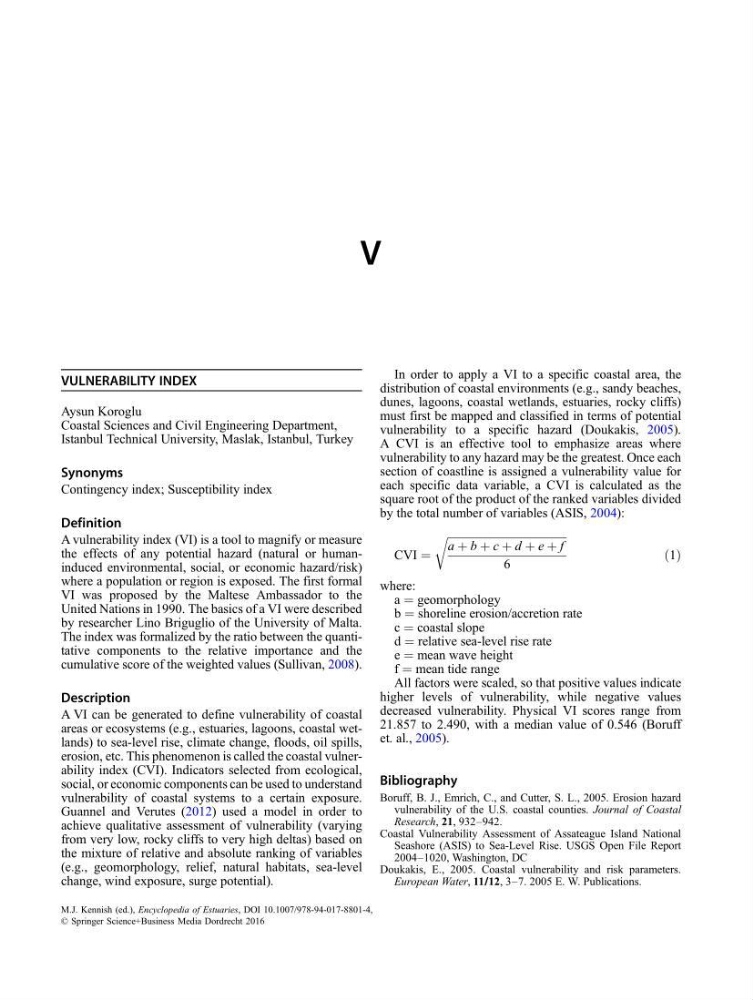
each specific data variable, a CVI is calculated as the
square root of the product of the ranked variables divided
by the total number of variables (ASIS, 2004):
CVI ¼
ffiffiffiffiffiffiffiffiffiffiffiffiffiffiffiffiffiffiffiffiffiffiffiffiffiffiffiffiffiffiffiffiffiffiffiffiffiffiffiffiffiffiffi ffi
a þ b þ c þ d þ e þ f
6
r
ð1Þ
where:
a ¼ geomorphology
b ¼ shoreline erosion/accretion rate
c ¼ coastal slope
d ¼ relative sea-level rise rate
e ¼ mean wave height
f ¼ mean tide range
All factors were scaled, so that positive values indicate
higher levels of vulnerability, while negative values
decreased vulnerability. Physical VI scores range from
21.857 to 2.490, with a median value of 0.546 (Boruff
et. al., 2005).
Bibliography
Boruff, B. J., Emrich, C., and Cutter, S. L., 2005. Erosion hazard
vulnerability of the U.S. coastal counties. Journal of Coastal
Research, 21, 932–942.
Coastal Vulnerability Assessment of Assateague Island National
Seashore (ASIS) to Sea-Level Rise. USGS Open File Report
2004–1020, Washington, DC
Doukakis, E., 2005. Coastal vulnerability and risk parameters.
European Water, 11/12, 3–7. 2005 E. W. Publications.
M.J. Kennish (ed.), Encyclopedia of Estuaries, DOI 10.1007/978-94-017-8801-4,
© Springer Science+Business Media Dordrecht 2016