

involves the classification of the gray values in the
processed aerial photographs to obtain the water and land
interface. Shoreline-change studies using remote sensing
techniques are highly accurate and cost-effective.
Satellite-imaging systems have increasingly improved
image resolution; the new generation of high-resolution
satellite imagery, such as QuickBird and IKONOS which
has a resolution of 1 m with stereo imaging capability, provides an example (Fritz, 1996; Li, 1998). An investigation
of shoreline mapping using such high-resolution satellite
images demonstrates a promising mapping accuracy of
2 m and a great reduction in the number of ground control
points required (Li et al., 2001).
Shoreline-change analysis
Shoreline change can be accurately evaluated by
subdividing the shoreline into smaller segments by creating
transects at right angles to a master shoreline. Shoreline
changes along the transects can be computed and further
used to predict future shoreline changes (Carter, 1986;
Kumar et al., 2010). This method has been adopted over
the years to establish the correspondence between shoreline
models acquired at different times to predict shoreline
change (Fenster et al., 1993; Maiti and Bhattacharya,
2009; Kumar et al., 2010). Rates of change are then
employed to summarize historical shoreline movements
and to predict future positions based on the perceived historical trends. The method commonly used especially by
coastal land planners and managers to predict future shoreline changes is an extrapolation of a constant rate of change
(Owens, 1985; Deepika et al., 2013). This method makes
use of successive shoreline data available over time, which
enables assessment of future shoreline changes by
reviewing the spatiotemporal changes of the shoreline.
Shoreline-change rate calculation methods
Due to the shifting of shoreline position and human influences on coastal processes and sediment sources, it is critical to determine whether the long- or short-term rates of
shoreline change reflect present-day shoreline dynamics.
This analysis may be complicated in areas that exhibit
trend reversals (erosion to accretion, and vice versa), or
where human activities, such as revetment construction,
have affected sediment sources and altered shoreline processes. An understanding and proper application of
short-term shoreline changes and long-term data are critical components for effective shoreline management. Professional judgment and knowledge of natural and human
impacts are essential in determining whether the long- or
short-term data should be used for management purposes
particularly in areas that exhibit significant or frequent
shoreline trend reversals or areas that have been extensively altered by human activities.
The shoreline-change calculation and prediction techniques allow the stability of a long-term trend relative to
intermediate (>50 years) and short-term (decennial) trend,
thereby relating the past with the expected future shoreline
positions. This section describes the various statistical
methods used to calculate shoreline-change data, as well
as the methodology used to generate the baseline and
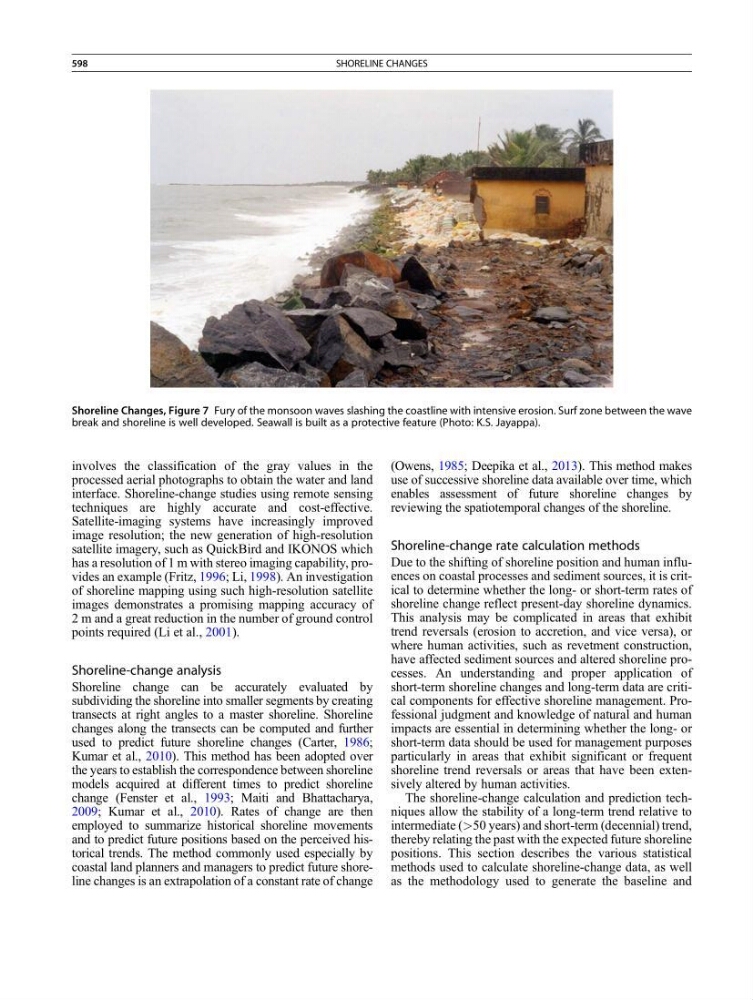
Shoreline Changes, Figure 7 Fury of the monsoon waves slashing the coastline with intensive erosion. Surf zone between the wave
break and shoreline is well developed. Seawall is built as a protective feature (Photo: K.S. Jayappa).
598
SHORELINE CHANGES