

Permeability
The permeability is proportional to the rate at which water
can flow through a given cross-section and distance or
height of a porous or granular material. The quantity of
fluid measured in this way is, in addition, directly proportional to the pressure difference at the two ends of the
experimental setup and inversely proportional to the
dynamic viscosity of the fluid. This relationship is
expressed by the following equation:
Q ¼ k Cp=L
ð
Þ
ð20Þ
where Q is the flow rate (in cm
3 s
À1
), k is the proportionality factor representing the permeability and is measured
in darcy (1 darcy being equivalent to 1 cm
3 of fluid having
a viscosity of 1 cP flowing through a cross-section of
1 cm
2 at a pressure difference of 1 atm), C is the crosssection of the core tube (in cm
2
) containing the sediment,
p is the pressure difference at the two ends of the tube
(in atm), is the dynamic viscosity of the fluid
(in centipoise), and L is the length of the tube (in cm).
As k is the unknown variable in this equation and Q is
determined for known values of C, p, , and L, the equation can be rearranged to be solved for permeability:
k ¼ Q= Cp=L
ð
Þ
ð20aÞ
As illustrated in Figure 5b, permeability is strongly
affected by grain size and sorting of sediment. It rapidly
increases with increasing grain size and improving
sorting, eventually reaching several thousand darcy in
well-sorted gravels. As the same grain-size parameters
also control the porosity, it stands to reason that permeability should correlate with porosity as a function of grain
size and sorting. This complex relationship is illustrated in
Figure 5c.
Atterberg limits
The Atterberg limits (cf. Casagrande, 1948) are rheological parameters used in the classification of soils, being of
particular importance in engineering geology and constructional engineering. They define the transitions from
the liquid state to the plastic state of a soil (liquid limit,
w l ), from the plastic state to the semisolid state (plastic
limit, w p ), and from the semisolid state to the solid state
(shrinkage limit, w s ). These transitions are a function of
the relative water content of a soil (definition see above)
which, in turn, is a function of soil composition and, especially in the presence of clay minerals, also their affinity to
attract water. The limits can thus vary strongly from one
soil to another, particularly where clay contents are high.
The liquid limit is determined by application of
a standard mechanical device specifically designed for
that purpose (cf. Lambe, 1951). It is defined by the water
content and the number of calibrated hammer blows
required to close a groove of specified depth and length
in a soil test sample. The plastic limit is reached when thin
threads of a soil 1/8 in. ($0.32 mm) in diameter begin to
crumble when manually rolled, whereas the shrinkage
limit is defined by the water content after just enough
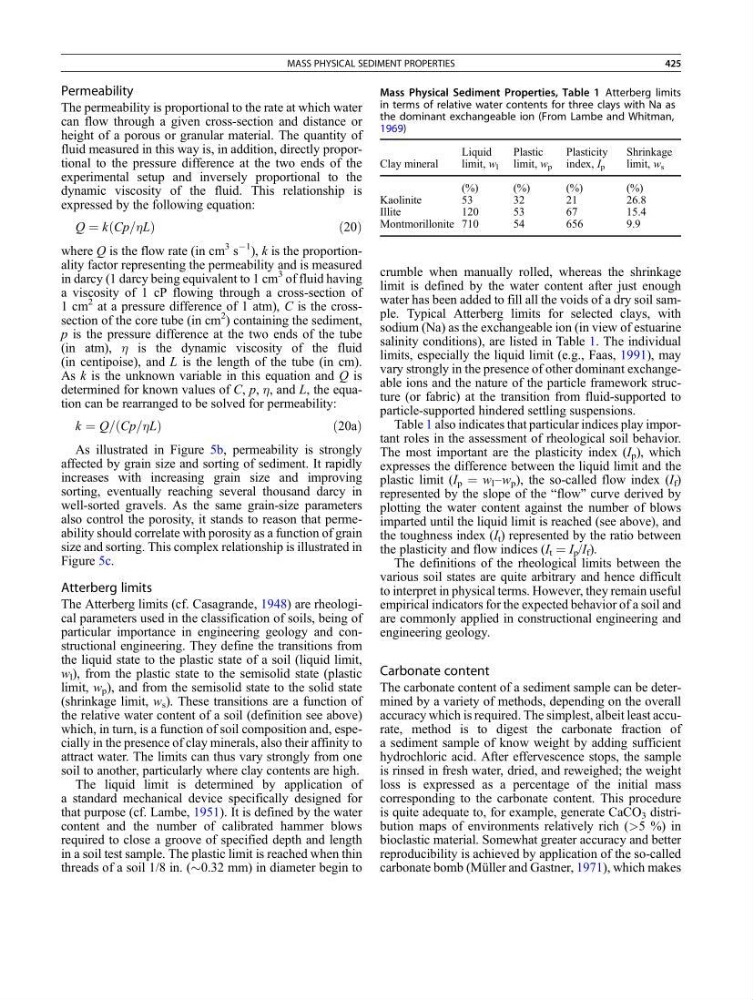
water has been added to fill all the voids of a dry soil sample. Typical Atterberg limits for selected clays, with
sodium (Na) as the exchangeable ion (in view of estuarine
salinity conditions), are listed in Table 1. The individual
limits, especially the liquid limit (e.g., Faas, 1991), may
vary strongly in the presence of other dominant exchangeable ions and the nature of the particle framework structure (or fabric) at the transition from fluid-supported to
particle-supported hindered settling suspensions.
Table 1 also indicates that particular indices play important roles in the assessment of rheological soil behavior.
The most important are the plasticity index (I p ), which
expresses the difference between the liquid limit and the
plastic limit (I p ¼ w l –w p ), the so-called flow index (I f )
represented by the slope of the “flow” curve derived by
plotting the water content against the number of blows
imparted until the liquid limit is reached (see above), and
the toughness index (I t ) represented by the ratio between
the plasticity and flow indices (I t ¼ I p /I f ).
The definitions of the rheological limits between the
various soil states are quite arbitrary and hence difficult
to interpret in physical terms. However, they remain useful
empirical indicators for the expected behavior of a soil and
are commonly applied in constructional engineering and
engineering geology.
Carbonate content
The carbonate content of a sediment sample can be determined by a variety of methods, depending on the overall
accuracy which is required. The simplest, albeit least accurate, method is to digest the carbonate fraction of
a sediment sample of know weight by adding sufficient
hydrochloric acid. After effervescence stops, the sample
is rinsed in fresh water, dried, and reweighed; the weight
loss is expressed as a percentage of the initial mass
corresponding to the carbonate content. This procedure
is quite adequate to, for example, generate CaCO 3 distribution maps of environments relatively rich (>5 %) in
bioclastic material. Somewhat greater accuracy and better
reproducibility is achieved by application of the so-called
carbonate bomb (Müller and Gastner, 1971), which makes
Mass Physical Sediment Properties, Table 1 Atterberg limits
in terms of relative water contents for three clays with Na as
the dominant exchangeable ion (From Lambe and Whitman,
1969)
Clay mineral
Liquid
limit, w l
Plastic
limit, w p
Plasticity
index, I p
Shrinkage
limit, w s
(%)
(%)
(%)
(%)
Kaolinite
53
32
21
26.8
Illite
120
53
67
15.4
Montmorillonite 710
54
656
9.9
MASS PHYSICAL SEDIMENT PROPERTIES
425
The permeability is proportional to the rate at which water
can flow through a given cross-section and distance or
height of a porous or granular material. The quantity of
fluid measured in this way is, in addition, directly proportional to the pressure difference at the two ends of the
experimental setup and inversely proportional to the
dynamic viscosity of the fluid. This relationship is
expressed by the following equation:
Q ¼ k Cp=L
ð
Þ
ð20Þ
where Q is the flow rate (in cm
3 s
À1
), k is the proportionality factor representing the permeability and is measured
in darcy (1 darcy being equivalent to 1 cm
3 of fluid having
a viscosity of 1 cP flowing through a cross-section of
1 cm
2 at a pressure difference of 1 atm), C is the crosssection of the core tube (in cm
2
) containing the sediment,
p is the pressure difference at the two ends of the tube
(in atm), is the dynamic viscosity of the fluid
(in centipoise), and L is the length of the tube (in cm).
As k is the unknown variable in this equation and Q is
determined for known values of C, p, , and L, the equation can be rearranged to be solved for permeability:
k ¼ Q= Cp=L
ð
Þ
ð20aÞ
As illustrated in Figure 5b, permeability is strongly
affected by grain size and sorting of sediment. It rapidly
increases with increasing grain size and improving
sorting, eventually reaching several thousand darcy in
well-sorted gravels. As the same grain-size parameters
also control the porosity, it stands to reason that permeability should correlate with porosity as a function of grain
size and sorting. This complex relationship is illustrated in
Figure 5c.
Atterberg limits
The Atterberg limits (cf. Casagrande, 1948) are rheological parameters used in the classification of soils, being of
particular importance in engineering geology and constructional engineering. They define the transitions from
the liquid state to the plastic state of a soil (liquid limit,
w l ), from the plastic state to the semisolid state (plastic
limit, w p ), and from the semisolid state to the solid state
(shrinkage limit, w s ). These transitions are a function of
the relative water content of a soil (definition see above)
which, in turn, is a function of soil composition and, especially in the presence of clay minerals, also their affinity to
attract water. The limits can thus vary strongly from one
soil to another, particularly where clay contents are high.
The liquid limit is determined by application of
a standard mechanical device specifically designed for
that purpose (cf. Lambe, 1951). It is defined by the water
content and the number of calibrated hammer blows
required to close a groove of specified depth and length
in a soil test sample. The plastic limit is reached when thin
threads of a soil 1/8 in. ($0.32 mm) in diameter begin to
crumble when manually rolled, whereas the shrinkage
limit is defined by the water content after just enough
water has been added to fill all the voids of a dry soil sample. Typical Atterberg limits for selected clays, with
sodium (Na) as the exchangeable ion (in view of estuarine
salinity conditions), are listed in Table 1. The individual
limits, especially the liquid limit (e.g., Faas, 1991), may
vary strongly in the presence of other dominant exchangeable ions and the nature of the particle framework structure (or fabric) at the transition from fluid-supported to
particle-supported hindered settling suspensions.
Table 1 also indicates that particular indices play important roles in the assessment of rheological soil behavior.
The most important are the plasticity index (I p ), which
expresses the difference between the liquid limit and the
plastic limit (I p ¼ w l –w p ), the so-called flow index (I f )
represented by the slope of the “flow” curve derived by
plotting the water content against the number of blows
imparted until the liquid limit is reached (see above), and
the toughness index (I t ) represented by the ratio between
the plasticity and flow indices (I t ¼ I p /I f ).
The definitions of the rheological limits between the
various soil states are quite arbitrary and hence difficult
to interpret in physical terms. However, they remain useful
empirical indicators for the expected behavior of a soil and
are commonly applied in constructional engineering and
engineering geology.
Carbonate content
The carbonate content of a sediment sample can be determined by a variety of methods, depending on the overall
accuracy which is required. The simplest, albeit least accurate, method is to digest the carbonate fraction of
a sediment sample of know weight by adding sufficient
hydrochloric acid. After effervescence stops, the sample
is rinsed in fresh water, dried, and reweighed; the weight
loss is expressed as a percentage of the initial mass
corresponding to the carbonate content. This procedure
is quite adequate to, for example, generate CaCO 3 distribution maps of environments relatively rich (>5 %) in
bioclastic material. Somewhat greater accuracy and better
reproducibility is achieved by application of the so-called
carbonate bomb (Müller and Gastner, 1971), which makes
Mass Physical Sediment Properties, Table 1 Atterberg limits
in terms of relative water contents for three clays with Na as
the dominant exchangeable ion (From Lambe and Whitman,
1969)
Clay mineral
Liquid
limit, w l
Plastic
limit, w p
Plasticity
index, I p
Shrinkage
limit, w s
(%)
(%)
(%)
(%)
Kaolinite
53
32
21
26.8
Illite
120
53
67
15.4
Montmorillonite 710
54
656
9.9
MASS PHYSICAL SEDIMENT PROPERTIES
425