

animal food, so that DDT and other chlorinated hydrocarbons contained in fish will
reach, via chicken, pork, veal, and trout, the human consumer.
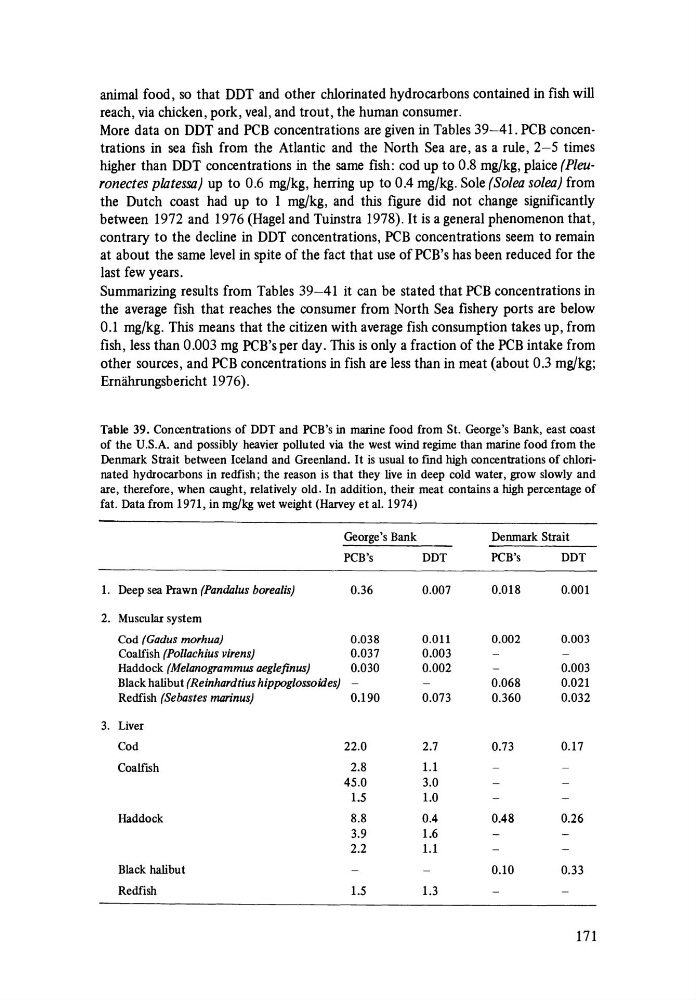
More data on DDT and PCB concentrations are given in Tables 39-41. PCB concentrations in sea fish from the Atlantic and the North Sea are, as a rule, 2-5 times
higher than DDT concentrations in the same fish: cod up to 0.8 mg/kg, plaice (P/euronectes pliJtessa) up to 0.6 mg/kg, herring up to 0.4 mg/kg. Sole (So/ea so/ea) from
the Dutch coast had up to 1 mg/kg, and this figure did not change significantly
between 1972 and 1976 (Hagel and Tuinstra 1978). It is a general phenomenon that,
contrary to the decline in DDT concentrations, PCB concentrations seem to remain
at about the same level in spite of the fact that use of PCB's has been reduced for the
last few years.
Summarizing results from Tables 39-41 it can be stated that PCB concentrations in
the average fish that reaches the consumer from North Sea fishery ports are below
0.1 mg/kg. This means that the citizen with average fish consumption takes up, from
fish, less than 0.003 mg PCB's per day. This is only a fraction of the PCB intake from
other sources, and PCB concentrations in fish are less than in meat (about 0.3 mg/kg;
Ernillmmgsbericht 1976).
Table 39. Concentrations of DDT and PCB's in marine food from St. George's Bank, east coast
of the U.S.A. and possibly heavier polluted via the west wind regime than marine food from the
Denmark Strait between Iceland and Greenland. It is usual to fmd high concentrations of chlorinated hydrocarbons in redfish; the reason is that they live in deep cold water, grow slowly and
are, therefore, when caught, relatively old. In addition, their meat contains a high percentage of
fat. Data from 1971, in mg/kg wet weight (Harvey et al. 1974)
George's Bank
Denmark Strait
PCB's
DDT
PCB's
DDT
l. Deep sea Prawn (pandalus borealis)
0.36
0.007
0.D18
0.001
2. Muscular system
Cod (Gadus morhua)
0.038
0.011
0.002
0.003
Coalfish (Pollachius virens)
0.037
0.003
Haddock (Melanogrammus aeglefinus)
0.030
0.002
0.003
Black halibut (Reinhardtius hippoglossoilles) -
0.068
0.021
Redfish (Sebastes marinus)
0.190
0.073
0.360
0.032
3. Liver
Cod
22.0
2.7
0.73
0.17
CoalfIsh
2.8
1.1
45.0
3.0
1.5
1.0
Haddock
8.8
0.4
0.48
0.26
3.9
1.6
2.2
1.1
Black halibut
0.10
0.33
Redfish
1.5
1.3
171
reach, via chicken, pork, veal, and trout, the human consumer.
More data on DDT and PCB concentrations are given in Tables 39-41. PCB concentrations in sea fish from the Atlantic and the North Sea are, as a rule, 2-5 times
higher than DDT concentrations in the same fish: cod up to 0.8 mg/kg, plaice (P/euronectes pliJtessa) up to 0.6 mg/kg, herring up to 0.4 mg/kg. Sole (So/ea so/ea) from
the Dutch coast had up to 1 mg/kg, and this figure did not change significantly
between 1972 and 1976 (Hagel and Tuinstra 1978). It is a general phenomenon that,
contrary to the decline in DDT concentrations, PCB concentrations seem to remain
at about the same level in spite of the fact that use of PCB's has been reduced for the
last few years.
Summarizing results from Tables 39-41 it can be stated that PCB concentrations in
the average fish that reaches the consumer from North Sea fishery ports are below
0.1 mg/kg. This means that the citizen with average fish consumption takes up, from
fish, less than 0.003 mg PCB's per day. This is only a fraction of the PCB intake from
other sources, and PCB concentrations in fish are less than in meat (about 0.3 mg/kg;
Ernillmmgsbericht 1976).
Table 39. Concentrations of DDT and PCB's in marine food from St. George's Bank, east coast
of the U.S.A. and possibly heavier polluted via the west wind regime than marine food from the
Denmark Strait between Iceland and Greenland. It is usual to fmd high concentrations of chlorinated hydrocarbons in redfish; the reason is that they live in deep cold water, grow slowly and
are, therefore, when caught, relatively old. In addition, their meat contains a high percentage of
fat. Data from 1971, in mg/kg wet weight (Harvey et al. 1974)
George's Bank
Denmark Strait
PCB's
DDT
PCB's
DDT
l. Deep sea Prawn (pandalus borealis)
0.36
0.007
0.D18
0.001
2. Muscular system
Cod (Gadus morhua)
0.038
0.011
0.002
0.003
Coalfish (Pollachius virens)
0.037
0.003
Haddock (Melanogrammus aeglefinus)
0.030
0.002
0.003
Black halibut (Reinhardtius hippoglossoilles) -
0.068
0.021
Redfish (Sebastes marinus)
0.190
0.073
0.360
0.032
3. Liver
Cod
22.0
2.7
0.73
0.17
CoalfIsh
2.8
1.1
45.0
3.0
1.5
1.0
Haddock
8.8
0.4
0.48
0.26
3.9
1.6
2.2
1.1
Black halibut
0.10
0.33
Redfish
1.5
1.3
171