

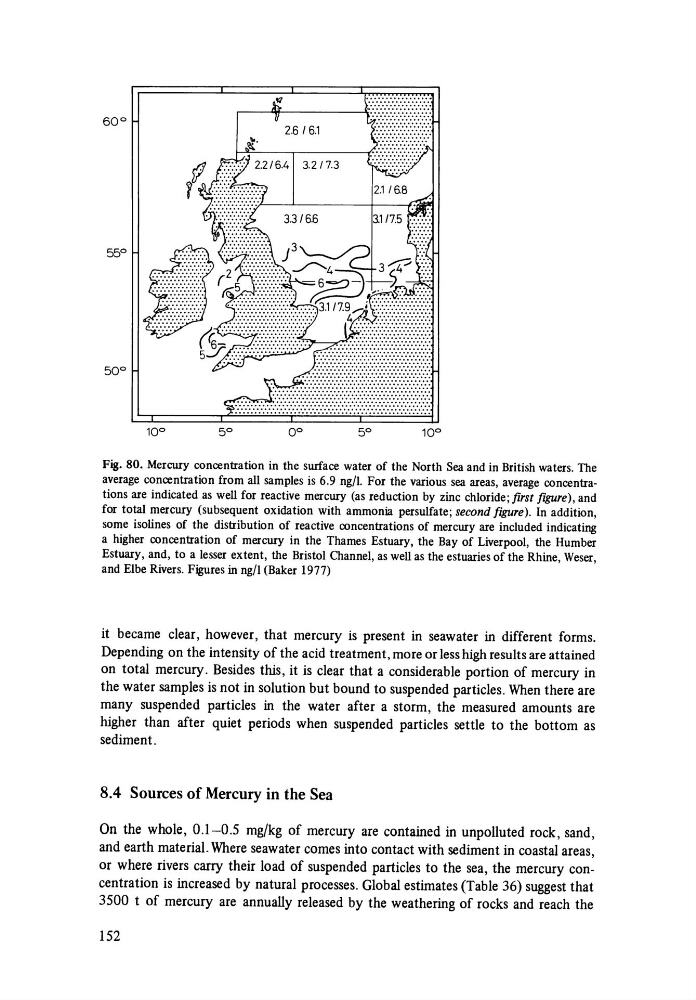
Fig. 80. Mercury concentration in the surface water of the North Sea and in British waters. The
average concentration from all samples is 6.9 ng/l. For the various sea areas, average concentrations are indicated as well for reactive mercury (as reduction by zinc chloride; first fIgUre), and
for total mercury (subsequent oxidation with ammonia persulfate; second fIgUre). In addition,
some isolines of the distribution of reactive concentrations of mercury are included indicating
a higher concentration of mercury in the Thames Estuary, the Bay of Liverpool, the Humber
Estuary, and, to a lesser extent, the Bristol Channel, as well as the estuaries of the Rhine, Weser,
and Elbe Rivers. Figures in ng/l (Baker 1977)
it became clear, however, that mercury is present in seawater in different forms.
Depending on the intensity of the acid treatment, more or less high results are attained
on total mercury. Besides this, it is clear that a considerable portion of mercury in
the water samples is not in solution but bound to suspended particles. When there are
many suspended particles in the water after a storm, the measured amounts are
higher than after quiet periods when suspended particles settle to the bottom as
sediment.
8.4 Sources of Mercury in the Sea
On the whole, 0.1-0.5 mg/kg of mercury are contained in unpolluted rock, sand,
and earth material. Where seawater comes into contact with sediment in coastal areas,
or where rivers carry their load of suspended particles to the sea, the mercury concentration is increased by natural processes. Global estimates (Table 36) suggest that
3500 t of mercury are annually released by the weathering of rocks and reach the
152
average concentration from all samples is 6.9 ng/l. For the various sea areas, average concentrations are indicated as well for reactive mercury (as reduction by zinc chloride; first fIgUre), and
for total mercury (subsequent oxidation with ammonia persulfate; second fIgUre). In addition,
some isolines of the distribution of reactive concentrations of mercury are included indicating
a higher concentration of mercury in the Thames Estuary, the Bay of Liverpool, the Humber
Estuary, and, to a lesser extent, the Bristol Channel, as well as the estuaries of the Rhine, Weser,
and Elbe Rivers. Figures in ng/l (Baker 1977)
it became clear, however, that mercury is present in seawater in different forms.
Depending on the intensity of the acid treatment, more or less high results are attained
on total mercury. Besides this, it is clear that a considerable portion of mercury in
the water samples is not in solution but bound to suspended particles. When there are
many suspended particles in the water after a storm, the measured amounts are
higher than after quiet periods when suspended particles settle to the bottom as
sediment.
8.4 Sources of Mercury in the Sea
On the whole, 0.1-0.5 mg/kg of mercury are contained in unpolluted rock, sand,
and earth material. Where seawater comes into contact with sediment in coastal areas,
or where rivers carry their load of suspended particles to the sea, the mercury concentration is increased by natural processes. Global estimates (Table 36) suggest that
3500 t of mercury are annually released by the weathering of rocks and reach the
152