

mg/kg r - - - - - - - - - - - - - ,
10
. : . / .
.. /
-. ......... ~
/ -
.
- .
o
3
5 6 7
fish meal s I week
mg/kg r - - - - - - - - - - - - - ,
100
10
.~ . .
. .
.
:
I
•
t&
•
•
~
: .
I
•
I
0.1
o
2 3
5 6
7
fish mea I s I week
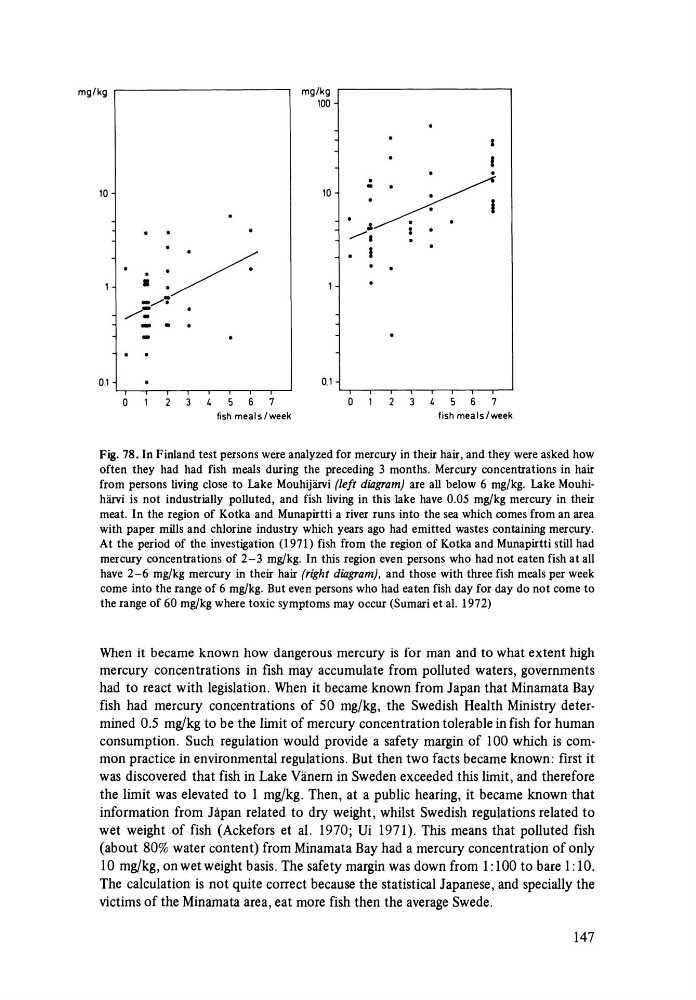
Fig. 78. In Finland test persons were analyzed for mercury in their hair, and they were asked how
often they had had fish meals during the preceding 3 months. Mercury concentrations in hair
from persons living close to Lake Mouhijiirvi (left diogram) are all below 6 mg/kg. Lake Mouhihiirvi is not industrially polluted, and fish living in this Jake have 0.05 mg/kg mercury in their
meat. In the region of Kotka and Munapirtti a river runs into the sea which comes from an area
with paper mills and chlorine industry which years ago had emitted wastes containing mercury.
At the period of the investigation (1971) fish from the region of Kotka and Munapirtti still had
mercury concentrations of 2-3 mg/kg. In this region even persons who had not eaten fish at all
have 2-6 mg/kg mercury in their hair (right diogram), and those with three fish meals per week
come into the range of 6 mg/kg. But even persons who had eaten fish day for day do not come to
the range of 60 mg/kg where toxic symptoms may occur (Sumari et al. 1972)
When it became known how dangerous mercury is for man and to what extent high
mercury concentrations in fish may accumulate from polluted waters, governments
had to react with legislation. When it became known from Japan that Minamata Bay
fish had mercury concentrations of 50 mg/kg, the Swedish Health Ministry determined 0.5 mg/kg to be the limit of mercury concentration tolerable in fish for human
consumption. Such regulation would provide a safety margin of 100 which is common practice in environmental regulations. But then two facts became known: first it
was discovered that fish in Lake Vanern in Sweden exceeded this limit, and therefore
the limit was elevated to 1 mg/kg. Then, at a public hearing, it became known that
information from Japan related to dry weight, whilst Swedish regulations related to
wet weight of fish (Ackefors et al. 1970; Vi 1971). This means that polluted fish
(about 80% water content) from Minamata Bay had a mercury concentration of only
10 mg/kg, on wet weight basis. The safety margin was down from 1: 100 to bare 1: 10.
The calculation is not quite correct because the statistical Japanese, and specially the
victims of the Minamata area, eat more fish then the average Swede.
147
10
. : . / .
.. /
-. ......... ~
/ -
.
- .
o
3
5 6 7
fish meal s I week
mg/kg r - - - - - - - - - - - - - ,
100
10
.~ . .
. .
.
:
I
•
t&
•
•
~
: .
I
•
I
0.1
o
2 3
5 6
7
fish mea I s I week
Fig. 78. In Finland test persons were analyzed for mercury in their hair, and they were asked how
often they had had fish meals during the preceding 3 months. Mercury concentrations in hair
from persons living close to Lake Mouhijiirvi (left diogram) are all below 6 mg/kg. Lake Mouhihiirvi is not industrially polluted, and fish living in this Jake have 0.05 mg/kg mercury in their
meat. In the region of Kotka and Munapirtti a river runs into the sea which comes from an area
with paper mills and chlorine industry which years ago had emitted wastes containing mercury.
At the period of the investigation (1971) fish from the region of Kotka and Munapirtti still had
mercury concentrations of 2-3 mg/kg. In this region even persons who had not eaten fish at all
have 2-6 mg/kg mercury in their hair (right diogram), and those with three fish meals per week
come into the range of 6 mg/kg. But even persons who had eaten fish day for day do not come to
the range of 60 mg/kg where toxic symptoms may occur (Sumari et al. 1972)
When it became known how dangerous mercury is for man and to what extent high
mercury concentrations in fish may accumulate from polluted waters, governments
had to react with legislation. When it became known from Japan that Minamata Bay
fish had mercury concentrations of 50 mg/kg, the Swedish Health Ministry determined 0.5 mg/kg to be the limit of mercury concentration tolerable in fish for human
consumption. Such regulation would provide a safety margin of 100 which is common practice in environmental regulations. But then two facts became known: first it
was discovered that fish in Lake Vanern in Sweden exceeded this limit, and therefore
the limit was elevated to 1 mg/kg. Then, at a public hearing, it became known that
information from Japan related to dry weight, whilst Swedish regulations related to
wet weight of fish (Ackefors et al. 1970; Vi 1971). This means that polluted fish
(about 80% water content) from Minamata Bay had a mercury concentration of only
10 mg/kg, on wet weight basis. The safety margin was down from 1: 100 to bare 1: 10.
The calculation is not quite correct because the statistical Japanese, and specially the
victims of the Minamata area, eat more fish then the average Swede.
147