

152
Horst Bleckmann et al.
begun before the water in the tank is quiet. A minishaker drives the sphere with
constant frequency and amplitude.
A
~
10
0
10
~ 0
Q) 10 J
.... .
·a.
!E.
·60dB
~ 0
rl 10 ;
Q)
i
~ I
'5 0
B 10 1
-70dB
0 1n1Ll!IJM•1~JJ,NW'NMh:!14HIIwrL11,!rl,
10 I
·80 dB
o ' H'\nnlly,dh.!tJ,.,Ih+JHIHtl:dN "I I'!
0
QS
1
1~
2
Time[s)
B
~160
c
~
~ 120
~
O.B
0.6
a:
c Q)
~
8
.§
0.4 ~
·c:
o.2 e
'5 c
·90 ·80 -70 -60 -50 -40 ·30 ·20 · 1 0
Attenuation [dB]
Ji
c
..
~
. :"1::1::
~~ 1~1
..
"§~ o'--- - - -11111
~---~
-60d8
0
0
5
10
15
20
Period[ms)
~
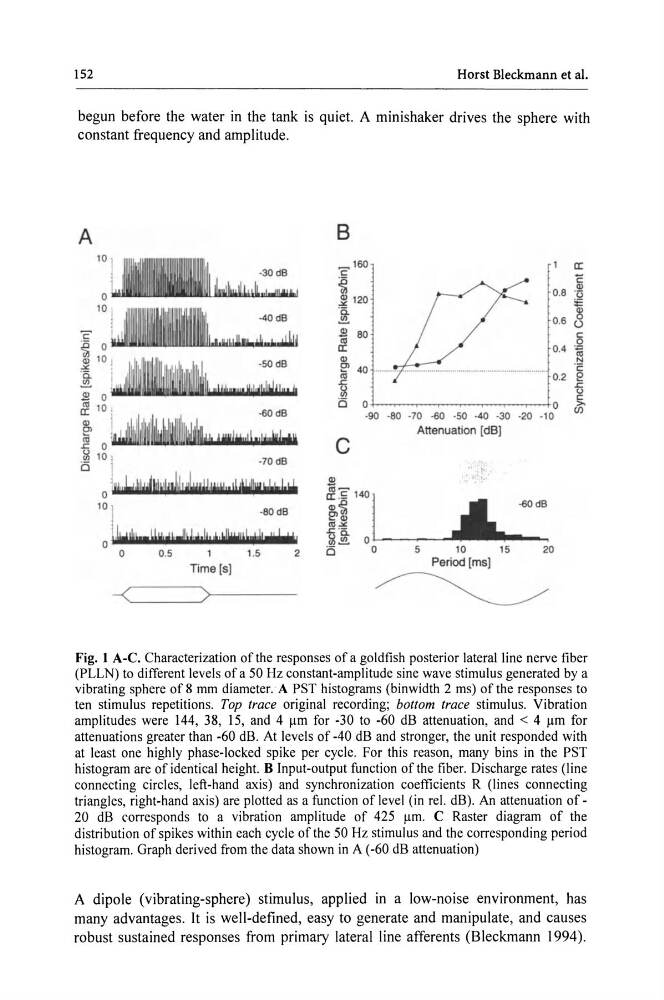
Fig. 1 A-C. Characterization of the responses of a goldfish posterior lateral line nerve fiber
(PLLN) to different levels of a 50 Hz constant-amplitude sine wave stimulus generated by a
vibrating sphere of 8 mm diameter. A PST histograms (binwidth 2 ms) of the responses to
ten stimulus repetitions. Top trace original recording; bottom trace stimulus. Vibration
amplitudes were 144, 38, 15, and 4 J.t.m for -30 to -60 dB attenuation, and < 4 Jlm for
attenuations greater than -60 dB. At levels of -40 dB and stronger, the unit responded with
at least one highly phase-locked spike per cycle. For this reason, many bins in the PST
histogram are of identical height B Input-output function of the fiber. Discharge rates (line
connecting circles, left-hand axis) and synchronization coefficients R (lines connecting
triangles, right-hand axis) are plotted as a function of level (in rel. dB). An attenuation of20 dB corresponds to a vibration amplitude of 425 J.t.m. C Raster diagram of the
distribution of spikes within each cycle of the 50 Hz stimulus and the corresponding period
histogram. Graph derived from the data shown in A ( -60 dB attenuation)
A dipole (vibrating-sphere) stimulus, applied in a low-noise environment, has
many advantages. It is well-defined, easy to generate and manipulate, and causes
robust sustained responses from primary lateral line afferents (Bleckmann 1994).
Horst Bleckmann et al.
begun before the water in the tank is quiet. A minishaker drives the sphere with
constant frequency and amplitude.
A
~
10
0
10
~ 0
Q) 10 J
.... .
·a.
!E.
·60dB
~ 0
rl 10 ;
Q)
i
~ I
'5 0
B 10 1
-70dB
0 1n1Ll!IJM•1~JJ,NW'NMh:!14HIIwrL11,!rl,
10 I
·80 dB
o ' H'\nnlly,dh.!tJ,.,Ih+JHIHtl:dN "I I'!
0
QS
1
1~
2
Time[s)
B
~160
c
~
~ 120
~
O.B
0.6
a:
c Q)
~
8
.§
0.4 ~
·c:
o.2 e
'5 c
·90 ·80 -70 -60 -50 -40 ·30 ·20 · 1 0
Attenuation [dB]
Ji
c
..
~
. :"1::1::
~~ 1~1
..
"§~ o'--- - - -11111
~---~
-60d8
0
0
5
10
15
20
Period[ms)
~
Fig. 1 A-C. Characterization of the responses of a goldfish posterior lateral line nerve fiber
(PLLN) to different levels of a 50 Hz constant-amplitude sine wave stimulus generated by a
vibrating sphere of 8 mm diameter. A PST histograms (binwidth 2 ms) of the responses to
ten stimulus repetitions. Top trace original recording; bottom trace stimulus. Vibration
amplitudes were 144, 38, 15, and 4 J.t.m for -30 to -60 dB attenuation, and < 4 Jlm for
attenuations greater than -60 dB. At levels of -40 dB and stronger, the unit responded with
at least one highly phase-locked spike per cycle. For this reason, many bins in the PST
histogram are of identical height B Input-output function of the fiber. Discharge rates (line
connecting circles, left-hand axis) and synchronization coefficients R (lines connecting
triangles, right-hand axis) are plotted as a function of level (in rel. dB). An attenuation of20 dB corresponds to a vibration amplitude of 425 J.t.m. C Raster diagram of the
distribution of spikes within each cycle of the 50 Hz stimulus and the corresponding period
histogram. Graph derived from the data shown in A ( -60 dB attenuation)
A dipole (vibrating-sphere) stimulus, applied in a low-noise environment, has
many advantages. It is well-defined, easy to generate and manipulate, and causes
robust sustained responses from primary lateral line afferents (Bleckmann 1994).