

Part D | 25.6
638 Part D Marine Algal Biotechnology
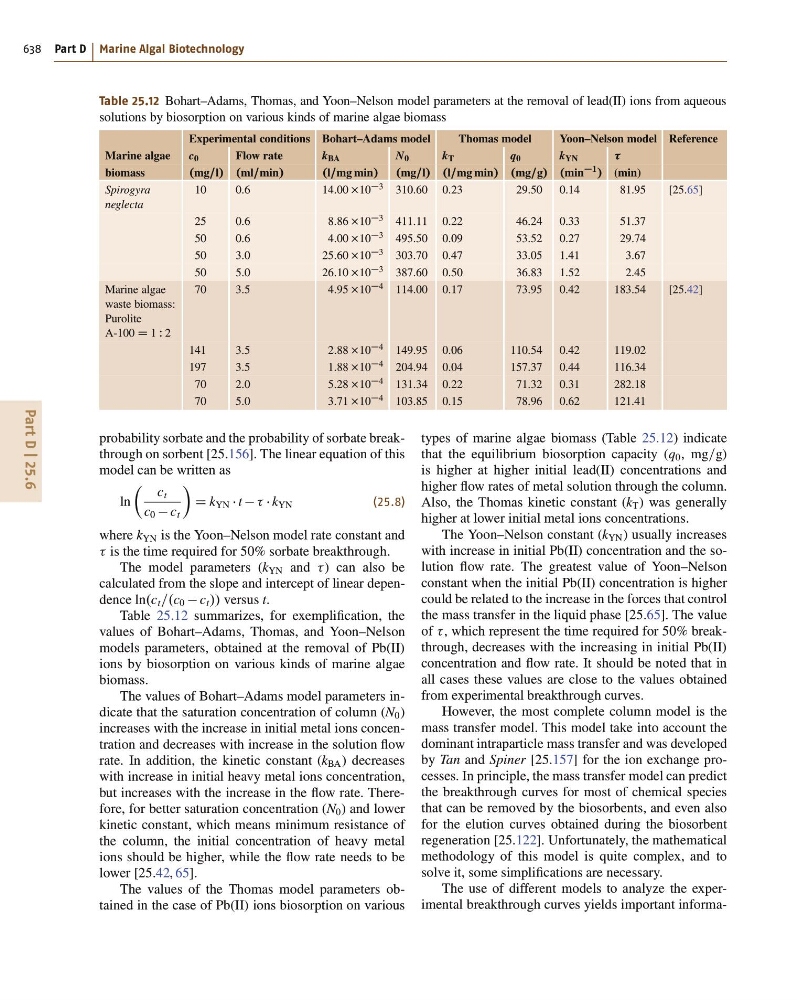
Table 25.12 Bohart–Adams, Thomas, and Yoon–Nelson model parameters at the removal of lead(II) ions from aqueous
solutions by biosorption on various kinds of marine algae biomass
Experimental conditions Bohart–Adams model
Thomas model
Yoon–Nelson model Reference
Marine algae
c 0
Flow rate
k BA
N 0
k T
q 0
k YN
biomass
.mg=l/ .ml=min/
.l=mg min/ .mg=l/ .l=mg min/ .mg=g/ .min
1 / (min)
Spirogyra
neglecta
10
0.6
14:00 10 3 310.60 0.23
29.50 0.14
81.95
[25.65]
25
0.6
8:86 10 3 411.11 0.22
46.24 0.33
51.37
50
0.6
4:00 10 3 495.50 0.09
53.52 0.27
29.74
50
3.0
25:60 10 3 303.70 0.47
33.05 1.41
3.67
50
5.0
26:10 10 3 387.60 0.50
36.83 1.52
2.45
Marine algae
waste biomass:
Purolite
A-100 D 1 W 2
70
3.5
4:95 10 114.00 0.17
73.95 0.42
183.54
[25.42]
141
3.5
2:88 10 4 149.95 0.06
110.54 0.42
119.02
197
3.5
1:88 10 4 204.94 0.04
157.37 0.44
116.34
70
2.0
5:28 10 4 131.34 0.22
71.32 0.31
282.18
70
5.0
3:71 10 4 103.85 0.15
78.96 0.62
121.41
probability sorbate and the probability of sorbate breakthrough on sorbent [25.156]. The linear equation of this
model can be written as
ln
 c t
c 0 c t
Ã
D k YN t k YN
(25.8)
where k YN is the Yoon–Nelson model rate constant and
is the time required for 50% sorbate breakthrough.
The model parameters (k YN and ) can also be
calculated from the slope and intercept of linear dependence ln.c t =.c 0 c t // versus t.
Table 25.12 summarizes, for exemplification, the
values of Bohart–Adams, Thomas, and Yoon–Nelson
models parameters, obtained at the removal of Pb(II)
ions by biosorption on various kinds of marine algae
biomass.
The values of Bohart–Adams model parameters indicate that the saturation concentration of column (N 0 )
increases with the increase in initial metal ions concentration and decreases with increase in the solution flow
rate. In addition, the kinetic constant (k BA ) decreases
with increase in initial heavy metal ions concentration,
but increases with the increase in the flow rate. Therefore, for better saturation concentration (N 0 ) and lower
kinetic constant, which means minimum resistance of
the column, the initial concentration of heavy metal
ions should be higher, while the flow rate needs to be
lower [25.42, 65].
The values of the Thomas model parameters obtained in the case of Pb(II) ions biosorption on various
types of marine algae biomass (Table 25.12) indicate
that the equilibrium biosorption capacity (q 0 , mg=g)
is higher at higher initial lead(II) concentrations and
higher flow rates of metal solution through the column.
Also, the Thomas kinetic constant (k T ) was generally
higher at lower initial metal ions concentrations.
The Yoon–Nelson constant (k YN ) usually increases
with increase in initial Pb(II) concentration and the solution flow rate. The greatest value of Yoon–Nelson
constant when the initial Pb(II) concentration is higher
could be related to the increase in the forces that control
the mass transfer in the liquid phase [25.65]. The value
of , which represent the time required for 50% breakthrough, decreases with the increasing in initial Pb(II)
concentration and flow rate. It should be noted that in
all cases these values are close to the values obtained
from experimental breakthrough curves.
However, the most complete column model is the
mass transfer model. This model take into account the
dominant intraparticle mass transfer and was developed
by Tan and Spiner [25.157] for the ion exchange processes. In principle, the mass transfer model can predict
the breakthrough curves for most of chemical species
that can be removed by the biosorbents, and even also
for the elution curves obtained during the biosorbent
regeneration [25.122]. Unfortunately, the mathematical
methodology of this model is quite complex, and to
solve it, some simplifications are necessary.
The use of different models to analyze the experimental breakthrough curves yields important informa-