

Part D | 25.5
636 Part D Marine Algal Biotechnology
biosorption kinetics of heavy metal ions on marine algae biomass, and they are listed in Table 25.10.
A plot of ln(q e q t ) versus t should generate
a straight line, according to the pseudo-first order Lagregen model, and the kinetic parameters can be calculated from the slope (k 1 ) and the intercept (lnq e ). In the
case of the pseudo-second order Ho model, the graphical representation of (t=q t ) versus t will give a straight
line with the intercept of 1=k 2 , and slope of 1=q e . The
calculated values of q e , from both the kinetic models
are then compared with that experimental values.
The shape of graphical dependences and comparison of experimental and calculated values of biosorption capacity at equilibrium (q e ) can help deciding
which kinetic model is followed by the biosorption
process. On the other hand, to obtain the best-fitting
kinetic model, the linear regression is used to analyze
the experimental data [25.145]. So, the value of the
linear regression coefficient (R
2 ) is another factor that
influences such decision. A value of R
2
> 0:98 shows
that the model is suitable for describing the biosorption
kinetics [25.150].
Table 25.11 summarizes the values of kinetic parameters of the pseudo-first and pseudo-second order
kinetic models together with the corresponding correlation coefficients (R
2 ) for biosorption of some heavy
metal ions on various types of marine algae and marine
algae waste biomass.
It is clear that most of biosorption processes that
use marine algae or marine algae waste biomass for the
removal of heavy metal ions from aqueous solutions are
very well described by the pseudo-second order kinetic
model.
The pseudo-second order kinetic model is based on
the assumption that the rate-controlling step in the adsorption process, are the chemical interactions between
superficial functional groups of biosorbent and heavy
metal ions from aqueous solution, and similar behaviors have been reported for various types of adsorbent
materials [25.15, 16, 18]. The great advantage of this
model is its great accuracy in describing the whole kinetic experimental data. In addition, the high values of
rate constants (k 2 , g=mg min) obtained in the case of
these biosorbents (Table 25.11) indicate that the rate
of the biosorption process is limited by the availability of heavy metal ions and functional groups from the
biosorbent surface to interact. When the availability of
the superficial functional groups is higher, the rate of
adsorption process is also higher.
In the biosorption system where the possibility that
the intraparticle diffusion to be the rate-controlling step,
the intraparticle diffusion approach described by Weber
and Morrison is used. The kinetic equation of the intraparticle diffusion model [25.151] is
q t D k dif t
1=2
C c
(25.5)
where: k dif is the intraparticle diffusion rate constant
(mg=g min
1=2 ), and c is the concentration of heavy metals from solution at equilibrium (mg=l).
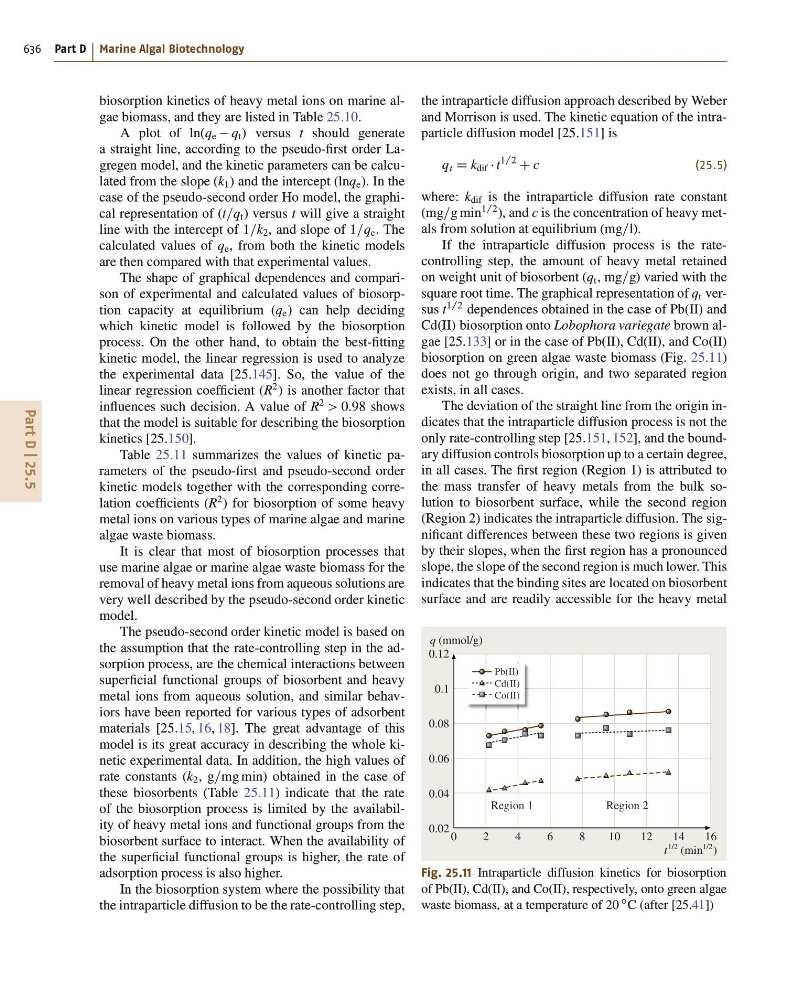
If the intraparticle diffusion process is the ratecontrolling step, the amount of heavy metal retained
on weight unit of biosorbent (q t , mg=g) varied with the
square root time. The graphical representation of q t versus t
1=2 dependences obtained in the case of Pb(II) and
Cd(II) biosorption onto Lobophora variegate brown algae [25.133] or in the case of Pb(II), Cd(II), and Co(II)
biosorption on green algae waste biomass (Fig. 25.11)
does not go through origin, and two separated region
exists, in all cases.
The deviation of the straight line from the origin indicates that the intraparticle diffusion process is not the
only rate-controlling step [25.151, 152], and the boundary diffusion controls biosorption up to a certain degree,
in all cases. The first region (Region 1) is attributed to
the mass transfer of heavy metals from the bulk solution to biosorbent surface, while the second region
(Region 2) indicates the intraparticle diffusion. The significant differences between these two regions is given
by their slopes, when the first region has a pronounced
slope, the slope of the second region is much lower. This
indicates that the binding sites are located on biosorbent
surface and are readily accessible for the heavy metal
Pb(II)
Cd(II)
Co(II)
0
2
4
Region 1
Region 2
6
8
12
10
14
16
q (mmol/g)
t
1/2 (min
1/2 )
0.12
0.1
0.08
0.06
0.04
0.02
Fig. 25.11 Intraparticle diffusion kinetics for biosorption
of Pb(II), Cd(II), and Co(II), respectively, onto green algae
waste biomass, at a temperature of 20
ı C (after [25.41])