

Part C | 18.2
476 Part C Marine Genomics
can quantify protein expression at a particular time
point. Thus, the proteome is the link between genotypic
and phenotypic variation, and consequently, reflects the
adaptability and physiology of an organism in relation
to its environment [18.4].
While it is not the purpose of this chapter to provide an in-depth explanation and evaluation of the
techniques used in proteomics, a general overview
of the tools used in proteomic studies will be
advantageous.
18.2 Overview of Proteomics Techniques
Polyacrylamide gel electrophoresis (PAGE) is the most
common and simplest technique used in proteomic
research [18.5]. A protein extract is suspended in
a sample buffer incorporating the anionic detergent
a)
Control
347
499
547 433
403 454
298
422
Experimental
110
70
55
40
35
25
15
b)
547 433 403
454
422
298
347
499
110
70
55
40
35
25
15
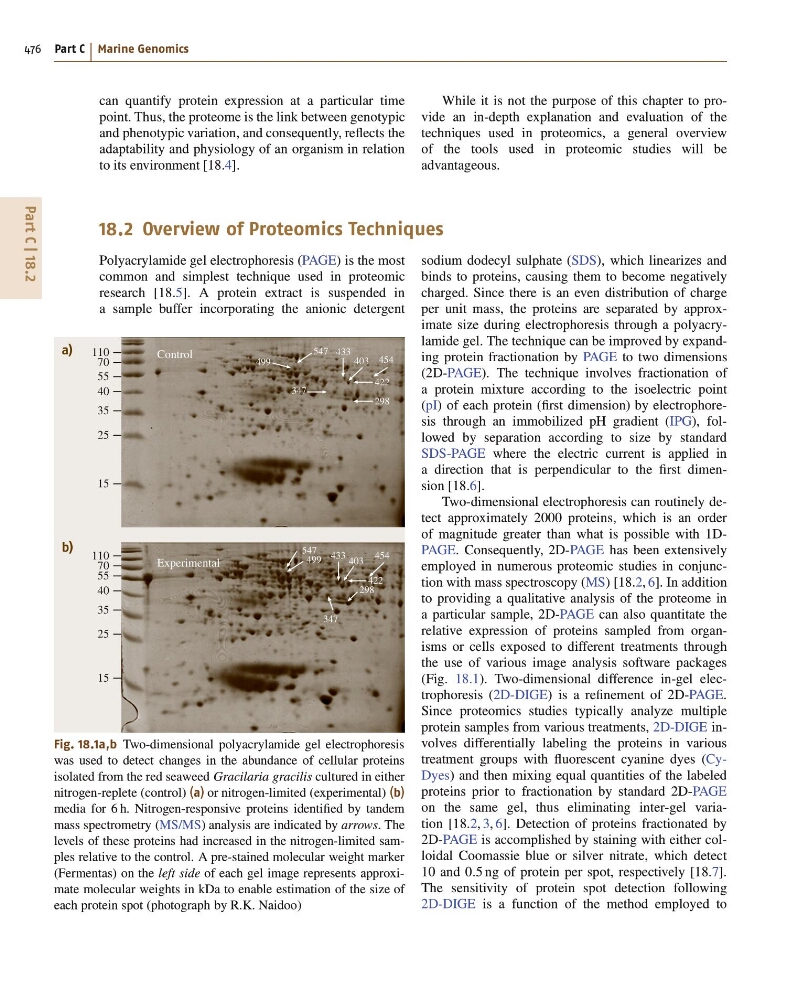
Fig. 18.1a,b Two-dimensional polyacrylamide gel electrophoresis
was used to detect changes in the abundance of cellular proteins
isolated from the red seaweed Gracilaria gracilis cultured in either
nitrogen-replete (control) (a) or nitrogen-limited (experimental) (b)
media for 6 h. Nitrogen-responsive proteins identified by tandem
mass spectrometry (MS/MS) analysis are indicated by arrows. The
levels of these proteins had increased in the nitrogen-limited samples relative to the control. A pre-stained molecular weight marker
(Fermentas) on the left side of each gel image represents approximate molecular weights in kDa to enable estimation of the size of
each protein spot (photograph by R.K. Naidoo)
sodium dodecyl sulphate (SDS), which linearizes and
binds to proteins, causing them to become negatively
charged. Since there is an even distribution of charge
per unit mass, the proteins are separated by approximate size during electrophoresis through a polyacrylamide gel. The technique can be improved by expanding protein fractionation by PAGE to two dimensions
(2D-PAGE). The technique involves fractionation of
a protein mixture according to the isoelectric point
(pI) of each protein (first dimension) by electrophoresis through an immobilized pH gradient (IPG), followed by separation according to size by standard
SDS-PAGE where the electric current is applied in
a direction that is perpendicular to the first dimension [18.6].
Two-dimensional electrophoresis can routinely detect approximately 2000 proteins, which is an order
of magnitude greater than what is possible with 1DPAGE. Consequently, 2D-PAGE has been extensively
employed in numerous proteomic studies in conjunction with mass spectroscopy (MS) [18.2, 6]. In addition
to providing a qualitative analysis of the proteome in
a particular sample, 2D-PAGE can also quantitate the
relative expression of proteins sampled from organisms or cells exposed to different treatments through
the use of various image analysis software packages
(Fig. 18.1). Two-dimensional difference in-gel electrophoresis (2D-DIGE) is a refinement of 2D-PAGE.
Since proteomics studies typically analyze multiple
protein samples from various treatments, 2D-DIGE involves differentially labeling the proteins in various
treatment groups with fluorescent cyanine dyes (CyDyes) and then mixing equal quantities of the labeled
proteins prior to fractionation by standard 2D-PAGE
on the same gel, thus eliminating inter-gel variation [18.2, 3, 6]. Detection of proteins fractionated by
2D-PAGE is accomplished by staining with either colloidal Coomassie blue or silver nitrate, which detect
10 and 0:5 ng of protein per spot, respectively [18.7].
The sensitivity of protein spot detection following
2D-DIGE is a function of the method employed to
476 Part C Marine Genomics
can quantify protein expression at a particular time
point. Thus, the proteome is the link between genotypic
and phenotypic variation, and consequently, reflects the
adaptability and physiology of an organism in relation
to its environment [18.4].
While it is not the purpose of this chapter to provide an in-depth explanation and evaluation of the
techniques used in proteomics, a general overview
of the tools used in proteomic studies will be
advantageous.
18.2 Overview of Proteomics Techniques
Polyacrylamide gel electrophoresis (PAGE) is the most
common and simplest technique used in proteomic
research [18.5]. A protein extract is suspended in
a sample buffer incorporating the anionic detergent
a)
Control
347
499
547 433
403 454
298
422
Experimental
110
70
55
40
35
25
15
b)
547 433 403
454
422
298
347
499
110
70
55
40
35
25
15
Fig. 18.1a,b Two-dimensional polyacrylamide gel electrophoresis
was used to detect changes in the abundance of cellular proteins
isolated from the red seaweed Gracilaria gracilis cultured in either
nitrogen-replete (control) (a) or nitrogen-limited (experimental) (b)
media for 6 h. Nitrogen-responsive proteins identified by tandem
mass spectrometry (MS/MS) analysis are indicated by arrows. The
levels of these proteins had increased in the nitrogen-limited samples relative to the control. A pre-stained molecular weight marker
(Fermentas) on the left side of each gel image represents approximate molecular weights in kDa to enable estimation of the size of
each protein spot (photograph by R.K. Naidoo)
sodium dodecyl sulphate (SDS), which linearizes and
binds to proteins, causing them to become negatively
charged. Since there is an even distribution of charge
per unit mass, the proteins are separated by approximate size during electrophoresis through a polyacrylamide gel. The technique can be improved by expanding protein fractionation by PAGE to two dimensions
(2D-PAGE). The technique involves fractionation of
a protein mixture according to the isoelectric point
(pI) of each protein (first dimension) by electrophoresis through an immobilized pH gradient (IPG), followed by separation according to size by standard
SDS-PAGE where the electric current is applied in
a direction that is perpendicular to the first dimension [18.6].
Two-dimensional electrophoresis can routinely detect approximately 2000 proteins, which is an order
of magnitude greater than what is possible with 1DPAGE. Consequently, 2D-PAGE has been extensively
employed in numerous proteomic studies in conjunction with mass spectroscopy (MS) [18.2, 6]. In addition
to providing a qualitative analysis of the proteome in
a particular sample, 2D-PAGE can also quantitate the
relative expression of proteins sampled from organisms or cells exposed to different treatments through
the use of various image analysis software packages
(Fig. 18.1). Two-dimensional difference in-gel electrophoresis (2D-DIGE) is a refinement of 2D-PAGE.
Since proteomics studies typically analyze multiple
protein samples from various treatments, 2D-DIGE involves differentially labeling the proteins in various
treatment groups with fluorescent cyanine dyes (CyDyes) and then mixing equal quantities of the labeled
proteins prior to fractionation by standard 2D-PAGE
on the same gel, thus eliminating inter-gel variation [18.2, 3, 6]. Detection of proteins fractionated by
2D-PAGE is accomplished by staining with either colloidal Coomassie blue or silver nitrate, which detect
10 and 0:5 ng of protein per spot, respectively [18.7].
The sensitivity of protein spot detection following
2D-DIGE is a function of the method employed to