

Part B | 9.3
268 Part B Tools and Methods in Marine Biotechnology
Air in
Air out
Air in
Air out
Medium /cell mass in
a)
b)
c)
Culture out
v, C N , C x
v o , C N, o
v o , C N, o , C x, o
v, C N
Air in
Air out
Medium in
Spent medium
V
V
V
C x
C x
Batch
• Aeration continuous
• Medium closed
• Biomass closed
Continuous
• Aeration continuous
• Medium continuous
• Biomass continuous
Perfusion
• Aeration continuous
• Medium continuous
• Biomass closed
C x
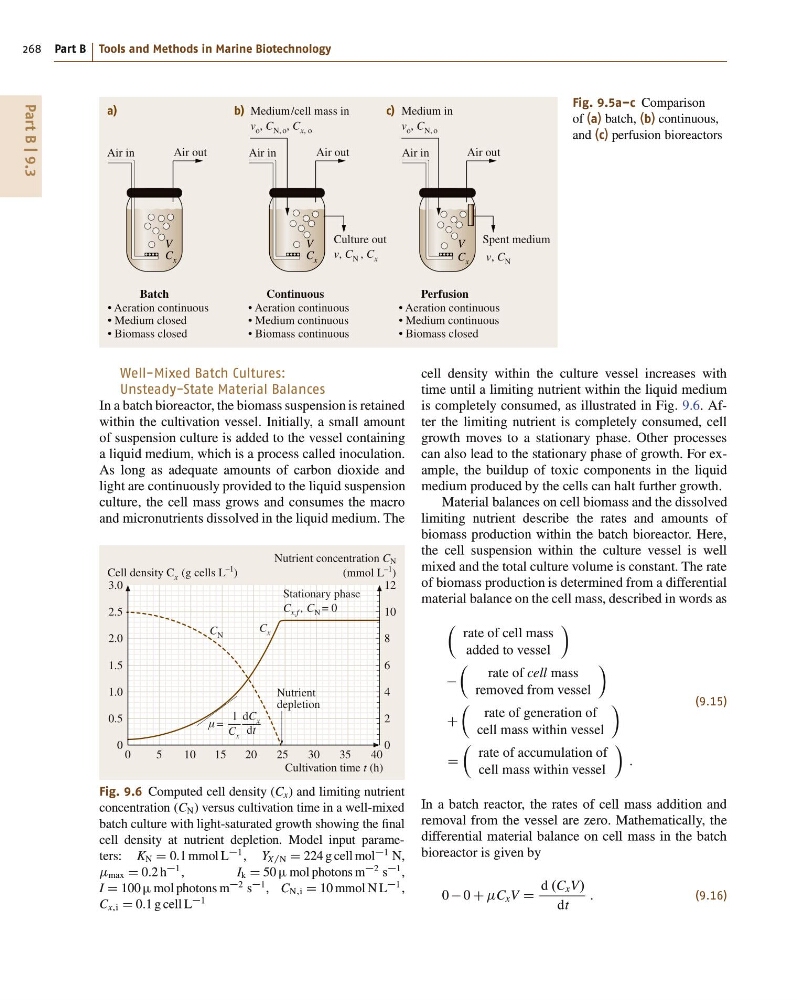
Fig. 9.5a–c Comparison
of (a) batch, (b) continuous,
and (c) perfusion bioreactors
Well-Mixed Batch Cultures:
Unsteady-State Material Balances
In a batch bioreactor, the biomass suspension is retained
within the cultivation vessel. Initially, a small amount
of suspension culture is added to the vessel containing
a liquid medium, which is a process called inoculation.
As long as adequate amounts of carbon dioxide and
light are continuously provided to the liquid suspension
culture, the cell mass grows and consumes the macro
and micronutrients dissolved in the liquid medium. The
0
0.5
1.0
1.5
2.0
2.5
3.0
Cultivation time t (h)
Cell density C x (g cells L
–1 )
0
2
4
6
8
10
12
Nutrient concentration C N
(mmol L
–1
)
Stationary phase
Nutrient
depletion
dt
C x
μ =
1
0
5
10
15
20
25
30
35
40
dC x
C x
C N
C x,f , C N = 0
Fig. 9.6 Computed cell density (C x ) and limiting nutrient
concentration (C N ) versus cultivation time in a well-mixed
batch culture with light-saturated growth showing the final
cell density at nutrient depletion. Model input parameters: K N D 0:1 mmol L
1 , Y X=N D 224 g cell mol
1 N,
max D 0:2 h
1 ,
I k D 50 mol photons m
2 s
1 ,
I D 100 mol photons m
2 s
1 , C N;i D 10 mmol N L
1 ,
C x;i D 0:1 g cell L
1
cell density within the culture vessel increases with
time until a limiting nutrient within the liquid medium
is completely consumed, as illustrated in Fig. 9.6. After the limiting nutrient is completely consumed, cell
growth moves to a stationary phase. Other processes
can also lead to the stationary phase of growth. For example, the buildup of toxic components in the liquid
medium produced by the cells can halt further growth.
Material balances on cell biomass and the dissolved
limiting nutrient describe the rates and amounts of
biomass production within the batch bioreactor. Here,
the cell suspension within the culture vessel is well
mixed and the total culture volume is constant. The rate
of biomass production is determined from a differential
material balance on the cell mass, described in words as
Â
rate of cell mass
added to vessel
Ã
Â
rate of cell mass
removed from vessel
Ã
C
Â
rate of generation of
cell mass within vessel
Ã
D
Â
rate of accumulation of
cell mass within vessel
Ã
:
(9.15)
In a batch reactor, the rates of cell mass addition and
removal from the vessel are zero. Mathematically, the
differential material balance on cell mass in the batch
bioreactor is given by
0 0 C C x V D
d .C x V/
dt
:
(9.16)
268 Part B Tools and Methods in Marine Biotechnology
Air in
Air out
Air in
Air out
Medium /cell mass in
a)
b)
c)
Culture out
v, C N , C x
v o , C N, o
v o , C N, o , C x, o
v, C N
Air in
Air out
Medium in
Spent medium
V
V
V
C x
C x
Batch
• Aeration continuous
• Medium closed
• Biomass closed
Continuous
• Aeration continuous
• Medium continuous
• Biomass continuous
Perfusion
• Aeration continuous
• Medium continuous
• Biomass closed
C x
Fig. 9.5a–c Comparison
of (a) batch, (b) continuous,
and (c) perfusion bioreactors
Well-Mixed Batch Cultures:
Unsteady-State Material Balances
In a batch bioreactor, the biomass suspension is retained
within the cultivation vessel. Initially, a small amount
of suspension culture is added to the vessel containing
a liquid medium, which is a process called inoculation.
As long as adequate amounts of carbon dioxide and
light are continuously provided to the liquid suspension
culture, the cell mass grows and consumes the macro
and micronutrients dissolved in the liquid medium. The
0
0.5
1.0
1.5
2.0
2.5
3.0
Cultivation time t (h)
Cell density C x (g cells L
–1 )
0
2
4
6
8
10
12
Nutrient concentration C N
(mmol L
–1
)
Stationary phase
Nutrient
depletion
dt
C x
μ =
1
0
5
10
15
20
25
30
35
40
dC x
C x
C N
C x,f , C N = 0
Fig. 9.6 Computed cell density (C x ) and limiting nutrient
concentration (C N ) versus cultivation time in a well-mixed
batch culture with light-saturated growth showing the final
cell density at nutrient depletion. Model input parameters: K N D 0:1 mmol L
1 , Y X=N D 224 g cell mol
1 N,
max D 0:2 h
1 ,
I k D 50 mol photons m
2 s
1 ,
I D 100 mol photons m
2 s
1 , C N;i D 10 mmol N L
1 ,
C x;i D 0:1 g cell L
1
cell density within the culture vessel increases with
time until a limiting nutrient within the liquid medium
is completely consumed, as illustrated in Fig. 9.6. After the limiting nutrient is completely consumed, cell
growth moves to a stationary phase. Other processes
can also lead to the stationary phase of growth. For example, the buildup of toxic components in the liquid
medium produced by the cells can halt further growth.
Material balances on cell biomass and the dissolved
limiting nutrient describe the rates and amounts of
biomass production within the batch bioreactor. Here,
the cell suspension within the culture vessel is well
mixed and the total culture volume is constant. The rate
of biomass production is determined from a differential
material balance on the cell mass, described in words as
Â
rate of cell mass
added to vessel
Ã
Â
rate of cell mass
removed from vessel
Ã
C
Â
rate of generation of
cell mass within vessel
Ã
D
Â
rate of accumulation of
cell mass within vessel
Ã
:
(9.15)
In a batch reactor, the rates of cell mass addition and
removal from the vessel are zero. Mathematically, the
differential material balance on cell mass in the batch
bioreactor is given by
0 0 C C x V D
d .C x V/
dt
:
(9.16)