

Part B | 9.2
266 Part B Tools and Methods in Marine Biotechnology
where C A is the dissolved carbon dioxide concentration (mol L
1 ), C N is the dissolved limiting nutrient concentration (mol L
1 ), I is the light intensity
incident to the cell surface (mol photons m
2 s
1 ),
I k is the half-saturation constant for light intensity
(mol photons m
2 s
1 ), K A is the half-saturation constant for dissolved carbon dioxide (mol L
1 ), K N is the
half-saturation constant for the dissolved nutrient concentration, and max is the maximum possible specific
growth rate of the phototrophic organism (h
1
/. It is
important to note here that the dissolved nutrients are
expressed as concentration in the liquid surrounding the
cell whereas light is expressed as the photon flux incident to the cell. If the culture is not illuminated (I D 0),
then the specific growth rate is zero. Furthermore, if
the dissolved limiting nutrient concentration C N or the
dissolved CO 2 concentration C A are zero, the specific
growth rate is zero.
For many phototrophic marine organisms, values
for K A and K N are typically very small, often in the
range of only 10–100 mol L
1 . The specific growth
rate is assumed to follow zero-order kinetics with respect to the dissolved carbon dioxide concentration C A .
A zero-order process means that as long as C A is finite, the specific growth rate is not affected by C A .
However, if C A is zero, then is zero even if sufficient
dissolved nutrients and light are present. For zero-order
kinetics with respect to CO 2 , (9.10) reduces to
D
C A
K A C C A
C N
K N C C N
I
I k C I
max
Š
C N
K N C C N
I
I k C I
max :
(9.11)
A short-hand form of (9.11) is
Š
C N
K N C C N
0
;
(9.12)
where
0 represents the effect of light intensity alone
on the specific growth rate. Often, in liquid suspension culture the dissolved carbon dioxide concentration
C A is much higher than K A , and the limiting nutrient
concentration C N is much higher than K N . Under these
conditions, the growth kinetics are zero-order with respect to both of these variables and (9.12) becomes
Š max
I
I k C I
:
(9.13)
The effect of light intensity on the specific growth
rate deserves special attention, as this variable has
the most profound effect on the specific growth rate.
Light intensity is formally referred to as photosynthetically active radiation (PAR or irradiance) in the
range of 400700 nm wavelength. Irradiance is best
expressed as quantum photon flux with units of mol
photons m
2 s
1 . Further details on units of irradiance
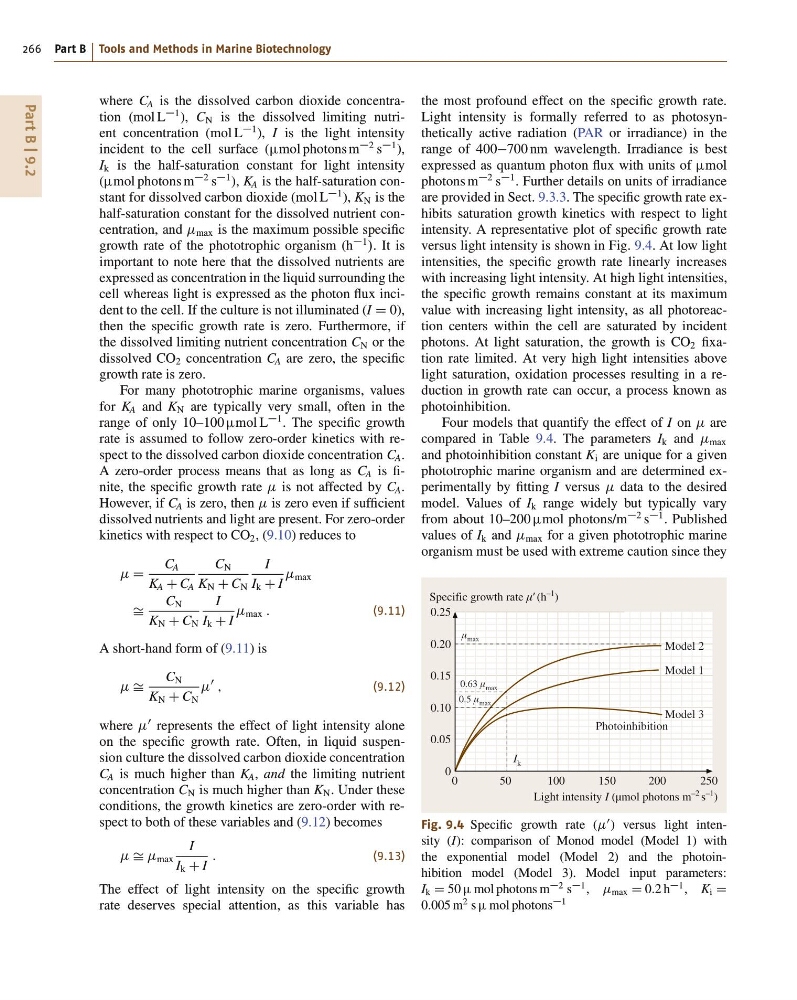
are provided in Sect. 9.3.3. The specific growth rate exhibits saturation growth kinetics with respect to light
intensity. A representative plot of specific growth rate
versus light intensity is shown in Fig. 9.4. At low light
intensities, the specific growth rate linearly increases
with increasing light intensity. At high light intensities,
the specific growth remains constant at its maximum
value with increasing light intensity, as all photoreaction centers within the cell are saturated by incident
photons. At light saturation, the growth is CO 2 fixation rate limited. At very high light intensities above
light saturation, oxidation processes resulting in a reduction in growth rate can occur, a process known as
photoinhibition.
Four models that quantify the effect of I on are
compared in Table 9.4. The parameters I k and max
and photoinhibition constant K i are unique for a given
phototrophic marine organism and are determined experimentally by fitting I versus data to the desired
model. Values of I k range widely but typically vary
from about 10–200 mol photons/m
2 s
1 . Published
values of I k and max for a given phototrophic marine
organism must be used with extreme caution since they
0
0.05
0.10
0.15
0.20
0.25
Light intensity I (µmol photons m
–2 s
–1 )
Specific growth rate μ’ (h
–1 )
0.63 μ max
0.5 μ max
I k
Model 3
Model 1
Model 2
Photoinhibition
0
50
100
150
200
250
μ max
Fig. 9.4 Specific growth rate (
0 ) versus light intensity (I): comparison of Monod model (Model 1) with
the exponential model (Model 2) and the photoinhibition model (Model 3). Model input parameters:
I k D 50 mol photons m
2 s
1 , max D 0:2 h
1 , K i D
0:005 m
2 s mol photons
1
266 Part B Tools and Methods in Marine Biotechnology
where C A is the dissolved carbon dioxide concentration (mol L
1 ), C N is the dissolved limiting nutrient concentration (mol L
1 ), I is the light intensity
incident to the cell surface (mol photons m
2 s
1 ),
I k is the half-saturation constant for light intensity
(mol photons m
2 s
1 ), K A is the half-saturation constant for dissolved carbon dioxide (mol L
1 ), K N is the
half-saturation constant for the dissolved nutrient concentration, and max is the maximum possible specific
growth rate of the phototrophic organism (h
1
/. It is
important to note here that the dissolved nutrients are
expressed as concentration in the liquid surrounding the
cell whereas light is expressed as the photon flux incident to the cell. If the culture is not illuminated (I D 0),
then the specific growth rate is zero. Furthermore, if
the dissolved limiting nutrient concentration C N or the
dissolved CO 2 concentration C A are zero, the specific
growth rate is zero.
For many phototrophic marine organisms, values
for K A and K N are typically very small, often in the
range of only 10–100 mol L
1 . The specific growth
rate is assumed to follow zero-order kinetics with respect to the dissolved carbon dioxide concentration C A .
A zero-order process means that as long as C A is finite, the specific growth rate is not affected by C A .
However, if C A is zero, then is zero even if sufficient
dissolved nutrients and light are present. For zero-order
kinetics with respect to CO 2 , (9.10) reduces to
D
C A
K A C C A
C N
K N C C N
I
I k C I
max
Š
C N
K N C C N
I
I k C I
max :
(9.11)
A short-hand form of (9.11) is
Š
C N
K N C C N
0
;
(9.12)
where
0 represents the effect of light intensity alone
on the specific growth rate. Often, in liquid suspension culture the dissolved carbon dioxide concentration
C A is much higher than K A , and the limiting nutrient
concentration C N is much higher than K N . Under these
conditions, the growth kinetics are zero-order with respect to both of these variables and (9.12) becomes
Š max
I
I k C I
:
(9.13)
The effect of light intensity on the specific growth
rate deserves special attention, as this variable has
the most profound effect on the specific growth rate.
Light intensity is formally referred to as photosynthetically active radiation (PAR or irradiance) in the
range of 400700 nm wavelength. Irradiance is best
expressed as quantum photon flux with units of mol
photons m
2 s
1 . Further details on units of irradiance
are provided in Sect. 9.3.3. The specific growth rate exhibits saturation growth kinetics with respect to light
intensity. A representative plot of specific growth rate
versus light intensity is shown in Fig. 9.4. At low light
intensities, the specific growth rate linearly increases
with increasing light intensity. At high light intensities,
the specific growth remains constant at its maximum
value with increasing light intensity, as all photoreaction centers within the cell are saturated by incident
photons. At light saturation, the growth is CO 2 fixation rate limited. At very high light intensities above
light saturation, oxidation processes resulting in a reduction in growth rate can occur, a process known as
photoinhibition.
Four models that quantify the effect of I on are
compared in Table 9.4. The parameters I k and max
and photoinhibition constant K i are unique for a given
phototrophic marine organism and are determined experimentally by fitting I versus data to the desired
model. Values of I k range widely but typically vary
from about 10–200 mol photons/m
2 s
1 . Published
values of I k and max for a given phototrophic marine
organism must be used with extreme caution since they
0
0.05
0.10
0.15
0.20
0.25
Light intensity I (µmol photons m
–2 s
–1 )
Specific growth rate μ’ (h
–1 )
0.63 μ max
0.5 μ max
I k
Model 3
Model 1
Model 2
Photoinhibition
0
50
100
150
200
250
μ max
Fig. 9.4 Specific growth rate (
0 ) versus light intensity (I): comparison of Monod model (Model 1) with
the exponential model (Model 2) and the photoinhibition model (Model 3). Model input parameters:
I k D 50 mol photons m
2 s
1 , max D 0:2 h
1 , K i D
0:005 m
2 s mol photons
1