

11
Table 4. Chlorophyll per unit biomass for natural populations at various seasons
and depth intervals in high latitudes. Hydrographical data indicate a homogeneous
colu~ within the stated depth intervals. Nitrogen and carbon has been corrected
for detrital interference according to Sakshaug (1978) and Olsen et al. (1982).
Data from VULCAN 6 and 7, 1981, the Trondheimsfjord (Sakshaug 1978) and the Norwegian Coastal Current (Sakshaug et al. 1981)
chl/C
no.
m
average
obs.
range
Blooms, >1.5 119: chl- l
Trondhe imsf jord (SkeZetonema)
early April
0-5
0.031
5
0.029-0.036
early May
late May
late May
Norwegian Coastal Current
late May
Vulcan 6 and 7
Jan-early
Jan-early
Oligotrophic, <1.5 119 chl- 1
Norwegian Coastal Current
late May
mid May
VULCAN 6 and 7
Jan-early
Jan-early
Jan-early
March
Jan-early
'50
000
50%
,%
200
400
200
W-m-2
Febr
Febr
Febr
Febr
Febr
Febr
400
0-5
0.025
6
0.020-0.032
0.,.5
0.015
9
0.013-0.018
9-10
0.044
4
0.034-0.050
0.,.30
0.015
3
0.013-0.019
0-40
0.014
5
0.010-0.018
50-75
0.025
3
0.014-0.032
0-30
0.010
11
0.004-0.011
0-30
0.015
9
0.006-0.029
0-40
0.0060
6
0.006-0.007
0-50
0.0082
6
0.003-0.010
0-75
0.013
1
0.013
0-50
0.020
7
0.014-0.029
50-75
0.014
5
0.007-0.020
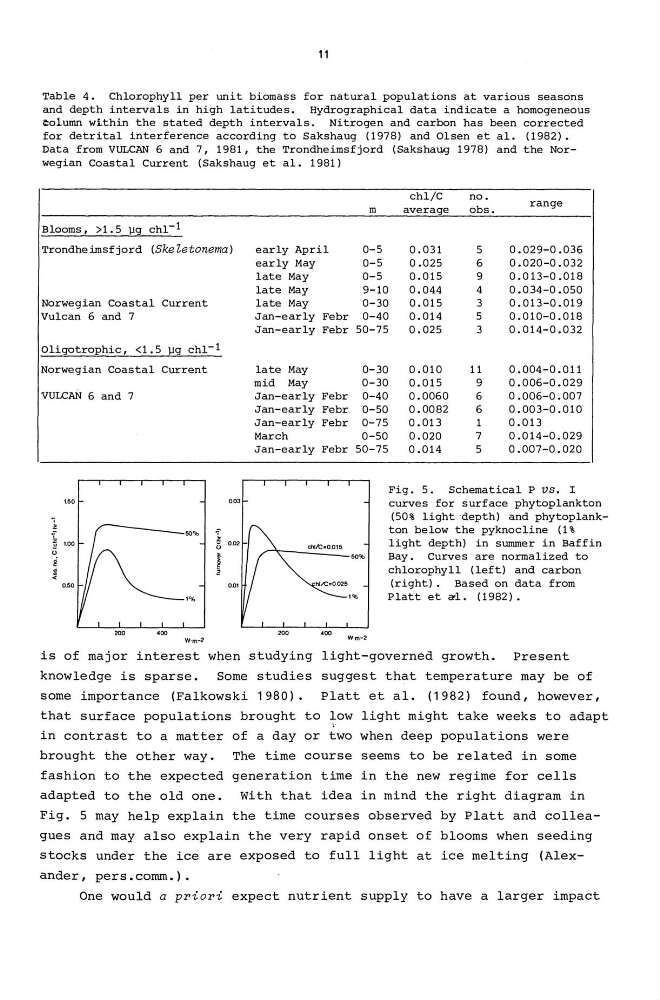
Fig. 5. Schematical P vs. I
curves for surface phytoplankton
(50% light depth) and phytoplankton below the pyknocline (1%
light depth) in summer in Baffin
Bay. Curves are normalized to
chlorophyll (left) and carbon
(right). Based on data from
Platt et aL (1982).
W·m-2
is of major interest when studying light-governed growth. Present
knowledge is sparse.
Some studies suggest that temperature may be of
some importance (Falkowski 1980). Platt et al. (1982) found, however,
that surface populations brought to low light might take weeks to adapt
,in contrast to a matter of a day or two when deep populations were
brought the other way. The time course seems to be related in some
fashion to the expected generation time in the new regime for cells
adapted to the old one. With that idea in mind the right diagram in
Fig. S may help explain the time courses observed by Platt and colleagues and may also explain the very rapid onset of blooms when seeding
stocks under the ice are exposed to full light at ice melting (Alexander, pers.comm.).
One would a priori expect nutrient supply to have a larger impact
Table 4. Chlorophyll per unit biomass for natural populations at various seasons
and depth intervals in high latitudes. Hydrographical data indicate a homogeneous
colu~ within the stated depth intervals. Nitrogen and carbon has been corrected
for detrital interference according to Sakshaug (1978) and Olsen et al. (1982).
Data from VULCAN 6 and 7, 1981, the Trondheimsfjord (Sakshaug 1978) and the Norwegian Coastal Current (Sakshaug et al. 1981)
chl/C
no.
m
average
obs.
range
Blooms, >1.5 119: chl- l
Trondhe imsf jord (SkeZetonema)
early April
0-5
0.031
5
0.029-0.036
early May
late May
late May
Norwegian Coastal Current
late May
Vulcan 6 and 7
Jan-early
Jan-early
Oligotrophic, <1.5 119 chl- 1
Norwegian Coastal Current
late May
mid May
VULCAN 6 and 7
Jan-early
Jan-early
Jan-early
March
Jan-early
'50
000
50%
,%
200
400
200
W-m-2
Febr
Febr
Febr
Febr
Febr
Febr
400
0-5
0.025
6
0.020-0.032
0.,.5
0.015
9
0.013-0.018
9-10
0.044
4
0.034-0.050
0.,.30
0.015
3
0.013-0.019
0-40
0.014
5
0.010-0.018
50-75
0.025
3
0.014-0.032
0-30
0.010
11
0.004-0.011
0-30
0.015
9
0.006-0.029
0-40
0.0060
6
0.006-0.007
0-50
0.0082
6
0.003-0.010
0-75
0.013
1
0.013
0-50
0.020
7
0.014-0.029
50-75
0.014
5
0.007-0.020
Fig. 5. Schematical P vs. I
curves for surface phytoplankton
(50% light depth) and phytoplankton below the pyknocline (1%
light depth) in summer in Baffin
Bay. Curves are normalized to
chlorophyll (left) and carbon
(right). Based on data from
Platt et aL (1982).
W·m-2
is of major interest when studying light-governed growth. Present
knowledge is sparse.
Some studies suggest that temperature may be of
some importance (Falkowski 1980). Platt et al. (1982) found, however,
that surface populations brought to low light might take weeks to adapt
,in contrast to a matter of a day or two when deep populations were
brought the other way. The time course seems to be related in some
fashion to the expected generation time in the new regime for cells
adapted to the old one. With that idea in mind the right diagram in
Fig. S may help explain the time courses observed by Platt and colleagues and may also explain the very rapid onset of blooms when seeding
stocks under the ice are exposed to full light at ice melting (Alexander, pers.comm.).
One would a priori expect nutrient supply to have a larger impact