

Photo
Mulliptier
Enission
.---=1-- Filt.,s
Dichroic
Filler
Sample
159
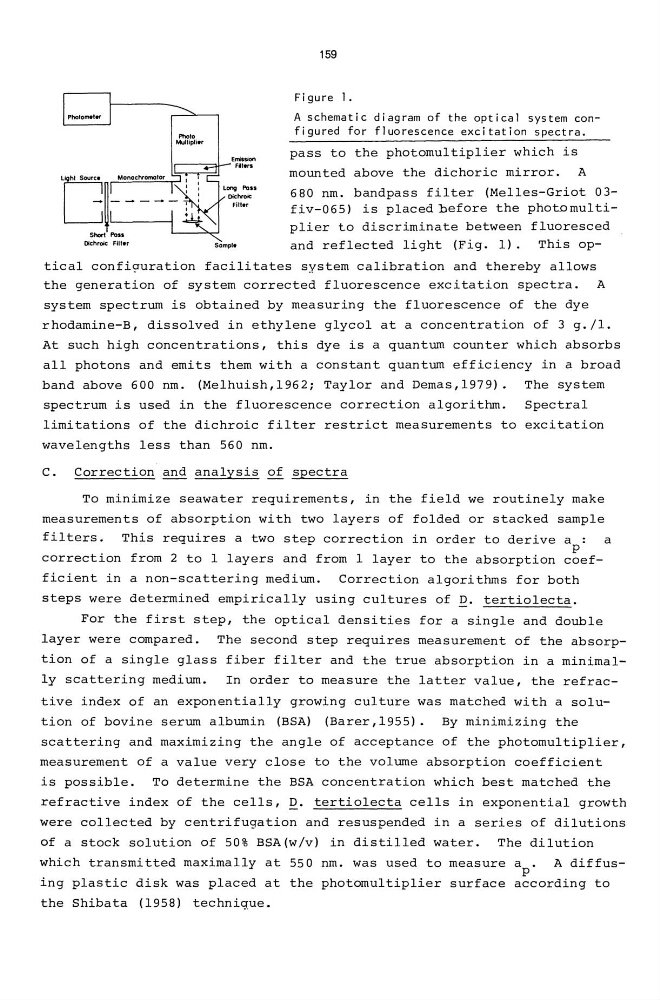
Figure 1.
A schematic diagram of the optical system configured for fluorescence excitation spectra.
pass to the photomultiplier which is
mounted above the dichoric mirror. A
680 nm. bandpass filter (Melles-Griot 03fiv-065) is placed before the photomultiplier to discriminate between fluoresced
and reflected light (Fig. 1). This optical confi~uration facilitates system calibration and thereby allows
the generation of system corrected fluorescence excitation spectra. A
system spectrum is obtained by measuring the fluorescence of the dye
rhodamine-B, dissolved in ethylene glycol at a concentration of 3 g./l.
At such high concentrations, this dye is a quantum counter which absorbs
all photons and emits them with a constant quantum efficiency in a broad
band above 600 nm. (Melhuish,1962; Taylor and Demas,1979). The system
spectrum is used in the fluorescence correction algorithm.
Spectral
limitations of the dichroic filter restrict measurements to excitation
wavelengths less than 560 nm.
C. Correction and analysis of spectra
To minimize seawater requirements, in the field we routinely make
measurements of absorption with two layers of folded or stacked sample
filters.
This requires a two step correction in order to derive a: a
p
correction from 2 to 1 layers and from 1 layer to the absorption coefficient in a non-scattering medium.
Correction algorithms for both
steps were determined empirically using cultures of Q. tertiolecta.
For the first step, the optical densities for a single and double
layer were compared. The second step requires measurement of the absorption of a single glass fiber filter and the true absorption in a minimally scattering medium.
In order to measure the latter value, the refractive index of an exponentially growing culture was matched with a solution of bovine serum albumin (BSA) (Barer,1955). By minimizing the
scattering and maximizing the angle of acceptance of the photomultiplier,
measurement of a value very close to the volume absorption coefficient
is possible. To determine the BSA concentration which best matched the
refractive index of the cells, D. tertiolecta cells in exponential growth
were collected by centrifugation and resuspended in a series of dilutions
of a stock solution of 50% BSA{w/v) in distilled water. The dilution
which transmitted maximally at 550 nm. was used to measure a
A diffusp
ing plastic disk was placed at the photomultiplier surface according to
the Shibata (1958) technique.
Mulliptier
Enission
.---=1-- Filt.,s
Dichroic
Filler
Sample
159
Figure 1.
A schematic diagram of the optical system configured for fluorescence excitation spectra.
pass to the photomultiplier which is
mounted above the dichoric mirror. A
680 nm. bandpass filter (Melles-Griot 03fiv-065) is placed before the photomultiplier to discriminate between fluoresced
and reflected light (Fig. 1). This optical confi~uration facilitates system calibration and thereby allows
the generation of system corrected fluorescence excitation spectra. A
system spectrum is obtained by measuring the fluorescence of the dye
rhodamine-B, dissolved in ethylene glycol at a concentration of 3 g./l.
At such high concentrations, this dye is a quantum counter which absorbs
all photons and emits them with a constant quantum efficiency in a broad
band above 600 nm. (Melhuish,1962; Taylor and Demas,1979). The system
spectrum is used in the fluorescence correction algorithm.
Spectral
limitations of the dichroic filter restrict measurements to excitation
wavelengths less than 560 nm.
C. Correction and analysis of spectra
To minimize seawater requirements, in the field we routinely make
measurements of absorption with two layers of folded or stacked sample
filters.
This requires a two step correction in order to derive a: a
p
correction from 2 to 1 layers and from 1 layer to the absorption coefficient in a non-scattering medium.
Correction algorithms for both
steps were determined empirically using cultures of Q. tertiolecta.
For the first step, the optical densities for a single and double
layer were compared. The second step requires measurement of the absorption of a single glass fiber filter and the true absorption in a minimally scattering medium.
In order to measure the latter value, the refractive index of an exponentially growing culture was matched with a solution of bovine serum albumin (BSA) (Barer,1955). By minimizing the
scattering and maximizing the angle of acceptance of the photomultiplier,
measurement of a value very close to the volume absorption coefficient
is possible. To determine the BSA concentration which best matched the
refractive index of the cells, D. tertiolecta cells in exponential growth
were collected by centrifugation and resuspended in a series of dilutions
of a stock solution of 50% BSA{w/v) in distilled water. The dilution
which transmitted maximally at 550 nm. was used to measure a
A diffusp
ing plastic disk was placed at the photomultiplier surface according to
the Shibata (1958) technique.