

146
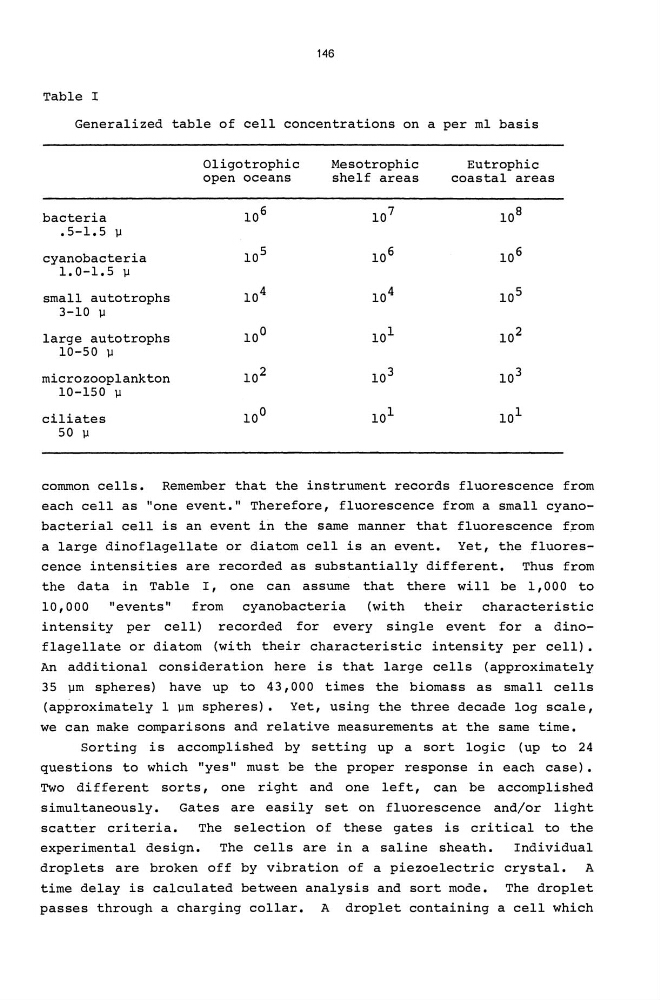
Table I
Generalized table of cell concentrations on a per m1 basis
Oligotrophic
Mesotrophic
Eutrophic
open oceans
shelf areas
coastal areas
bacteria
10 6
10 7
10 8
.5-1. 5 jJ
cyanobacteria
105
10 6
10 6
1. 0-1. 5 jJ
small autotrophs
10 4
10 4
105
3-10 jJ
large autotrophs
10 0
10 1
10 2
10-50 jJ
micro zooplankton
10 2
10 3
10 3
10-150 jJ
ciliates
10 0
10 1
10 1
50 jJ
common cells. Remember that the instrument records fluorescence from
each cell as "one event." Therefore, fluorescence from a small cyanobacterial cell is an event in the same manner that fluorescence f~om
a large dinoflagellate or diatom cell is an event. Yet, the fluorescence intensities are recorded as substantially different. Thus from
the data in Table I, one can assume that there will be 1,000 to
10,000
"events"
from cyanobacteria
(with their characteristic
intensity per cell) recorded for every single event for a dinoflagellate or diatom (with their characteristic intensity per cell).
An additional consideration here is that large cells (approximately
35 jJm spheres) have up to 43,000 times the biomass as small cells
(approximately 1 jJm spheres). Yet, using the three decade log scale,
we can make comparisons and relative measurements at the same time.
Sorting is accomplished by setting up a sort logic (up to 24
questions to which "yes" must be the proper response in each case).
Two different sorts, one right and one left, can be accomplished
simultaneously.
Gates are easily set on fluorescence and/or light
scatter criteria.
The selection of these gates is critical to the
experimental design.
The cells are in a saline sheath.
Individual
droplets are broken off by vibration of a piezoelectric crystal.
A
time delay is calculated between analysis and sort mode. The droplet
passes through a charging collar. A droplet containing a cell which
Table I
Generalized table of cell concentrations on a per m1 basis
Oligotrophic
Mesotrophic
Eutrophic
open oceans
shelf areas
coastal areas
bacteria
10 6
10 7
10 8
.5-1. 5 jJ
cyanobacteria
105
10 6
10 6
1. 0-1. 5 jJ
small autotrophs
10 4
10 4
105
3-10 jJ
large autotrophs
10 0
10 1
10 2
10-50 jJ
micro zooplankton
10 2
10 3
10 3
10-150 jJ
ciliates
10 0
10 1
10 1
50 jJ
common cells. Remember that the instrument records fluorescence from
each cell as "one event." Therefore, fluorescence from a small cyanobacterial cell is an event in the same manner that fluorescence f~om
a large dinoflagellate or diatom cell is an event. Yet, the fluorescence intensities are recorded as substantially different. Thus from
the data in Table I, one can assume that there will be 1,000 to
10,000
"events"
from cyanobacteria
(with their characteristic
intensity per cell) recorded for every single event for a dinoflagellate or diatom (with their characteristic intensity per cell).
An additional consideration here is that large cells (approximately
35 jJm spheres) have up to 43,000 times the biomass as small cells
(approximately 1 jJm spheres). Yet, using the three decade log scale,
we can make comparisons and relative measurements at the same time.
Sorting is accomplished by setting up a sort logic (up to 24
questions to which "yes" must be the proper response in each case).
Two different sorts, one right and one left, can be accomplished
simultaneously.
Gates are easily set on fluorescence and/or light
scatter criteria.
The selection of these gates is critical to the
experimental design.
The cells are in a saline sheath.
Individual
droplets are broken off by vibration of a piezoelectric crystal.
A
time delay is calculated between analysis and sort mode. The droplet
passes through a charging collar. A droplet containing a cell which