

142
crowd.
But instead, we want to know several properties or parameters, such as team affiliation, height and weight, sex and age of
the individual.
These data are only obtainable if we make measurements not of the crowd, but of each individual as they file past an
observation point.
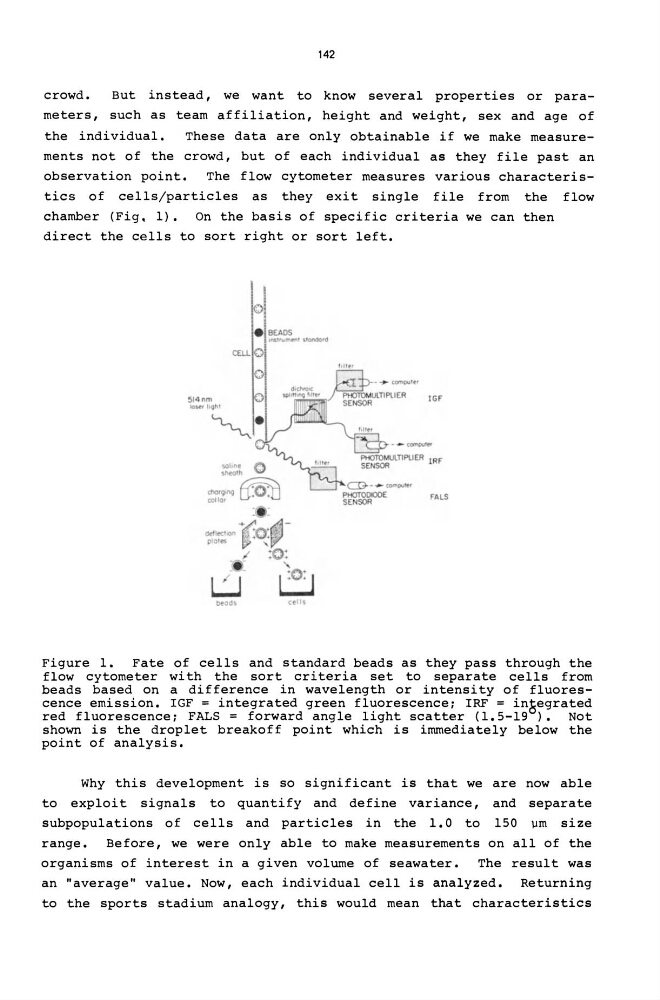
The flow cytometer measures various characteristics of cells/particles as they exit single file from the flow
chamber (Fig. 1). On the basis of specific criteria we can then
direct the cells to sort right or sort left •
• BEADS
IMI'\!I'Iet'\f ,lonGOr"
cru..O
deltO
( :0:
Figure 1. Fate of cells and standard beads as they pass through the
flow cytometer with the sort criteria set to separate cells from
beads based on a difference in wavelength or intensity of fluorescence emission. IGF = integrated green fluorescence; IRF = in~egrated
red fluorescence; FALS = forward angle light scatter (1.5-19). Not
shown is the droplet breakoff point which is immediately below the
point of analysis.
Why this development is so significant is that we are now able
to exploit signals to quantify and define variance, and separate
subpopulations of cells and particles in the 1. 0 to 150 llm size
range.
Before, we were only able to make measurements on all of the
organisms of interest in a given volume of seawater. The result was
an "average" value. NOW, each individual cell is analyzed. Returning
to the sports stadium analogy, this would mean that characteristics
crowd.
But instead, we want to know several properties or parameters, such as team affiliation, height and weight, sex and age of
the individual.
These data are only obtainable if we make measurements not of the crowd, but of each individual as they file past an
observation point.
The flow cytometer measures various characteristics of cells/particles as they exit single file from the flow
chamber (Fig. 1). On the basis of specific criteria we can then
direct the cells to sort right or sort left •
• BEADS
IMI'\!I'Iet'\f ,lonGOr"
cru..O
deltO
( :0:
Figure 1. Fate of cells and standard beads as they pass through the
flow cytometer with the sort criteria set to separate cells from
beads based on a difference in wavelength or intensity of fluorescence emission. IGF = integrated green fluorescence; IRF = in~egrated
red fluorescence; FALS = forward angle light scatter (1.5-19). Not
shown is the droplet breakoff point which is immediately below the
point of analysis.
Why this development is so significant is that we are now able
to exploit signals to quantify and define variance, and separate
subpopulations of cells and particles in the 1. 0 to 150 llm size
range.
Before, we were only able to make measurements on all of the
organisms of interest in a given volume of seawater. The result was
an "average" value. NOW, each individual cell is analyzed. Returning
to the sports stadium analogy, this would mean that characteristics