

104
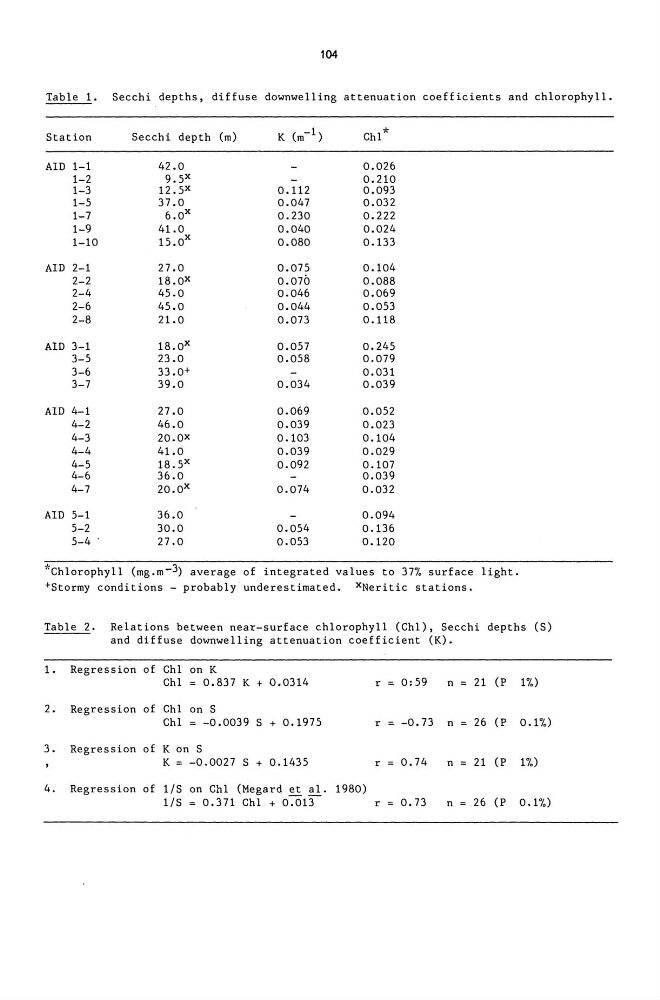
Table 1. Secchi depths, diffuse downwelling attenuation coefficients and chlorophyll.
Station
Secchi depth (m)
K (m- 1 )
Chl*
AID 1-1
42.0
0.026
1-2
9.5 x
0.210
1-3
12.5x
0.112
0.093
1-5
37.0
0.047
0.032
1-7
6.0 x
0.230
0.222
1-9
41.0
0.040
0.024
1-10
15.0 x
0.080
0.133
AID 2-1
27.0
0.075
0.104
2-2
18.0x
0.070
0.088
2-4
45.0
0.046
0.069
2-6
45.0
0.044
0.053
2-8
21.0
0.073
0.118
AID 3-1
18.0 x
0.057
0.245
3-5
23.0
0.058
0.079
3-6
33.0+
0.031
3-7
39.0
0.034
0.039
AID 4-1
27.0
0.069
0.052
4-2
46.0
0.039
0.023
4-3
20.0x
0.103
0.104
4-4
41.0
0.039
0.029
4-5
18.5 x
0.092
0.107
4-6
36.0
0.039
4-7
20.0x
0.074
0.032
AID 5-1
36.0
0.094
5-2
30.0
0.054
0.136
5-4
27.0
0.053
0.120
*Chlorophyll (mg.m-3) average of integrated values to 37% surface light.
+5tormy conditions - probably underestimated. xNeritic stations.
Table 2. Relations between near-surface chlorophyll (ChI), 5ecchi depths (5)
and diffuse downwelling attenuation coefficient (K).
1. Regression of ChI on K
ChI = 0.837 K + 0.0314
r
0:59
n
21 (P 1'7.)
2. Regression of ChI on 5
ChI = -0.0039 5 + 0.1975
r
-0.73 n
26 (P 0.1'7.)
3. Regression of K on 5
K = -0.0027 5 + 0.1435
r
0.74
n
21 (P 1%)
4. Regression of 1/5 on ChI (Megard et al. 1980)
1/5 = 0.371 ChI + 0.013
r
0.73
n
26 (P 0.1%)
Table 1. Secchi depths, diffuse downwelling attenuation coefficients and chlorophyll.
Station
Secchi depth (m)
K (m- 1 )
Chl*
AID 1-1
42.0
0.026
1-2
9.5 x
0.210
1-3
12.5x
0.112
0.093
1-5
37.0
0.047
0.032
1-7
6.0 x
0.230
0.222
1-9
41.0
0.040
0.024
1-10
15.0 x
0.080
0.133
AID 2-1
27.0
0.075
0.104
2-2
18.0x
0.070
0.088
2-4
45.0
0.046
0.069
2-6
45.0
0.044
0.053
2-8
21.0
0.073
0.118
AID 3-1
18.0 x
0.057
0.245
3-5
23.0
0.058
0.079
3-6
33.0+
0.031
3-7
39.0
0.034
0.039
AID 4-1
27.0
0.069
0.052
4-2
46.0
0.039
0.023
4-3
20.0x
0.103
0.104
4-4
41.0
0.039
0.029
4-5
18.5 x
0.092
0.107
4-6
36.0
0.039
4-7
20.0x
0.074
0.032
AID 5-1
36.0
0.094
5-2
30.0
0.054
0.136
5-4
27.0
0.053
0.120
*Chlorophyll (mg.m-3) average of integrated values to 37% surface light.
+5tormy conditions - probably underestimated. xNeritic stations.
Table 2. Relations between near-surface chlorophyll (ChI), 5ecchi depths (5)
and diffuse downwelling attenuation coefficient (K).
1. Regression of ChI on K
ChI = 0.837 K + 0.0314
r
0:59
n
21 (P 1'7.)
2. Regression of ChI on 5
ChI = -0.0039 5 + 0.1975
r
-0.73 n
26 (P 0.1'7.)
3. Regression of K on 5
K = -0.0027 5 + 0.1435
r
0.74
n
21 (P 1%)
4. Regression of 1/5 on ChI (Megard et al. 1980)
1/5 = 0.371 ChI + 0.013
r
0.73
n
26 (P 0.1%)