

72
Sand content showed a general upward-increasing trend indicating the flooding
of the formerly reclaimed land as regeneration continued (Table 2.3; Fig. 2.19):
from a very low and variable content in DI 3 (average 5%), a low and upwardincreasing content in the intermediate DI 2 (average 14%), to a slightly higher and
relatively constant content in DI 1 (average 16%).
2.6.3.2 Dating the Sedimentary Record
210
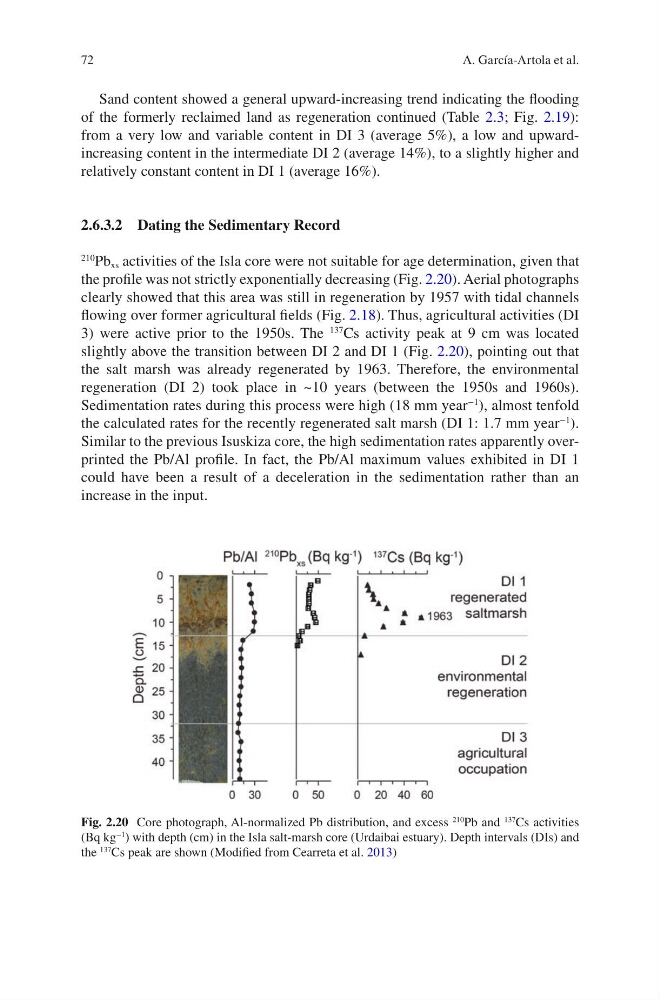
Pb xs activities of the Isla core were not suitable for age determination, given that
the profile was not strictly exponentially decreasing (Fig. 2.20). Aerial photographs
clearly showed that this area was still in regeneration by 1957 with tidal channels
flowing over former agricultural fields (Fig. 2.18). Thus, agricultural activities (DI
3) were active prior to the 1950s. The
137
Cs activity peak at 9 cm was located
slightly above the transition between DI 2 and DI 1 (Fig. 2.20), pointing out that
the salt marsh was already regenerated by 1963. Therefore, the environmental
regeneration (DI 2) took place in ~10 years (between the 1950s and 1960s).
Sedimentation rates during this process were high (18 mm year
−1
), almost tenfold
the calculated rates for the recently regenerated salt marsh (DI 1: 1.7 mm year
−1
).
Similar to the previous Isuskiza core, the high sedimentation rates apparently overprinted the Pb/Al profile. In fact, the Pb/Al maximum values exhibited in DI 1
could have been a result of a deceleration in the sedimentation rather than an
increase in the input.
Fig. 2.20 Core photograph, Al-normalized Pb distribution, and excess
210
Pb and
137
Cs activities
(Bq kg
−1
) with depth (cm) in the Isla salt-marsh core (Urdaibai estuary). Depth intervals (DIs) and
the
137 Cs peak are shown (Modified from Cearreta et al. 2013)
A. García-Artola et al.
Sand content showed a general upward-increasing trend indicating the flooding
of the formerly reclaimed land as regeneration continued (Table 2.3; Fig. 2.19):
from a very low and variable content in DI 3 (average 5%), a low and upwardincreasing content in the intermediate DI 2 (average 14%), to a slightly higher and
relatively constant content in DI 1 (average 16%).
2.6.3.2 Dating the Sedimentary Record
210
Pb xs activities of the Isla core were not suitable for age determination, given that
the profile was not strictly exponentially decreasing (Fig. 2.20). Aerial photographs
clearly showed that this area was still in regeneration by 1957 with tidal channels
flowing over former agricultural fields (Fig. 2.18). Thus, agricultural activities (DI
3) were active prior to the 1950s. The
137
Cs activity peak at 9 cm was located
slightly above the transition between DI 2 and DI 1 (Fig. 2.20), pointing out that
the salt marsh was already regenerated by 1963. Therefore, the environmental
regeneration (DI 2) took place in ~10 years (between the 1950s and 1960s).
Sedimentation rates during this process were high (18 mm year
−1
), almost tenfold
the calculated rates for the recently regenerated salt marsh (DI 1: 1.7 mm year
−1
).
Similar to the previous Isuskiza core, the high sedimentation rates apparently overprinted the Pb/Al profile. In fact, the Pb/Al maximum values exhibited in DI 1
could have been a result of a deceleration in the sedimentation rather than an
increase in the input.
Fig. 2.20 Core photograph, Al-normalized Pb distribution, and excess
210
Pb and
137
Cs activities
(Bq kg
−1
) with depth (cm) in the Isla salt-marsh core (Urdaibai estuary). Depth intervals (DIs) and
the
137 Cs peak are shown (Modified from Cearreta et al. 2013)
A. García-Artola et al.