

611
Sr. No.
Criteria
Value
1.
Obstruction in 1 ha area or more for more than or equal to 6 months
20
2.
Obstruction in 1 ha area or more for less than 6 months
40
3.
Obstruction in less than 1 ha area for more than or equal to 6 months
60
4.
Obstruction in less than 1 ha area for less than 6 months
80
5.
No obstruction
100
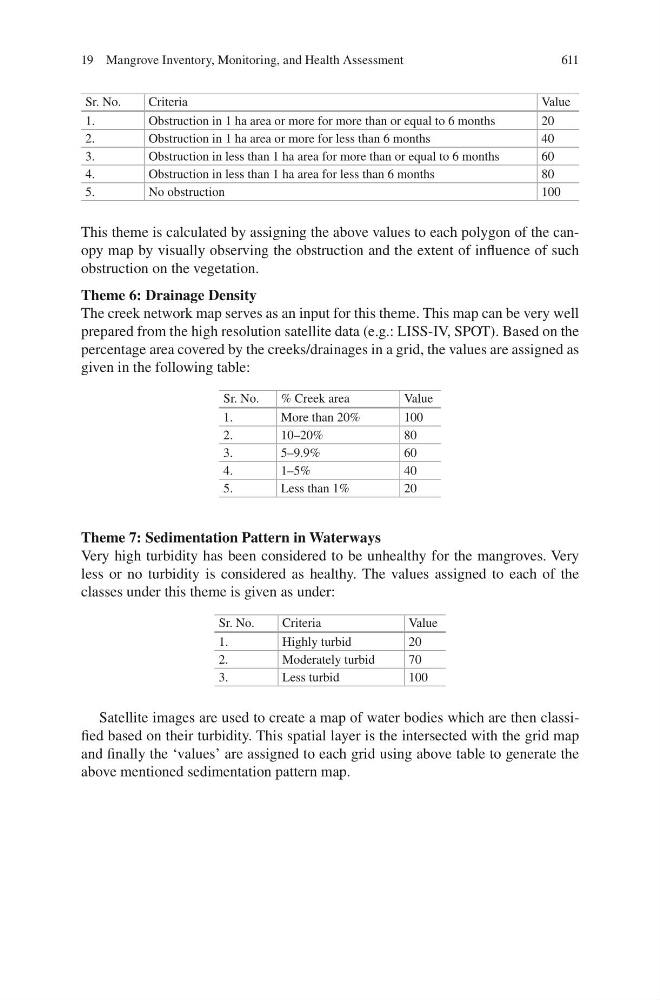
This theme is calculated by assigning the above values to each polygon of the canopy map by visually observing the obstruction and the extent of influence of such
obstruction on the vegetation.
Theme 6: Drainage Density
The creek network map serves as an input for this theme. This map can be very well
prepared from the high resolution satellite data (e.g.: LISS-IV, SPOT). Based on the
percentage area covered by the creeks/drainages in a grid, the values are assigned as
given in the following table:
Sr. No.
% Creek area
Value
1.
More than 20%
100
2.
10–20%
80
3.
5–9.9%
60
4.
1–5%
40
5.
Less than 1%
20
Theme 7: Sedimentation Pattern in Waterways
Very high turbidity has been considered to be unhealthy for the mangroves. Very
less or no turbidity is considered as healthy. The values assigned to each of the
classes under this theme is given as under:
Sr. No.
Criteria
Value
1.
Highly turbid
20
2.
Moderately turbid
70
3.
Less turbid
100
Satellite images are used to create a map of water bodies which are then classified based on their turbidity. This spatial layer is the intersected with the grid map
and finally the ‘values’ are assigned to each grid using above table to generate the
above mentioned sedimentation pattern map.
19 Mangrove Inventory, Monitoring, and Health Assessment
Sr. No.
Criteria
Value
1.
Obstruction in 1 ha area or more for more than or equal to 6 months
20
2.
Obstruction in 1 ha area or more for less than 6 months
40
3.
Obstruction in less than 1 ha area for more than or equal to 6 months
60
4.
Obstruction in less than 1 ha area for less than 6 months
80
5.
No obstruction
100
This theme is calculated by assigning the above values to each polygon of the canopy map by visually observing the obstruction and the extent of influence of such
obstruction on the vegetation.
Theme 6: Drainage Density
The creek network map serves as an input for this theme. This map can be very well
prepared from the high resolution satellite data (e.g.: LISS-IV, SPOT). Based on the
percentage area covered by the creeks/drainages in a grid, the values are assigned as
given in the following table:
Sr. No.
% Creek area
Value
1.
More than 20%
100
2.
10–20%
80
3.
5–9.9%
60
4.
1–5%
40
5.
Less than 1%
20
Theme 7: Sedimentation Pattern in Waterways
Very high turbidity has been considered to be unhealthy for the mangroves. Very
less or no turbidity is considered as healthy. The values assigned to each of the
classes under this theme is given as under:
Sr. No.
Criteria
Value
1.
Highly turbid
20
2.
Moderately turbid
70
3.
Less turbid
100
Satellite images are used to create a map of water bodies which are then classified based on their turbidity. This spatial layer is the intersected with the grid map
and finally the ‘values’ are assigned to each grid using above table to generate the
above mentioned sedimentation pattern map.
19 Mangrove Inventory, Monitoring, and Health Assessment