

422
is consumed during respiration and decomposition. Oxygen in lake water is also
influenced by wind and wave action through weather events and the exposure of
surface water to atmospheric sources.
An adequate supply of dissolved oxygen in lake water is essential to fish and
other aquatic life forms. DO is also a sensitive indicator of change in water quality,
and of the ability of a water body to support aquatic life. The loss, over time, of DO
in the deep areas of a lake, especially during summer months, may indicate that the
ecosystem is stressed and changing (VLMP 2016).
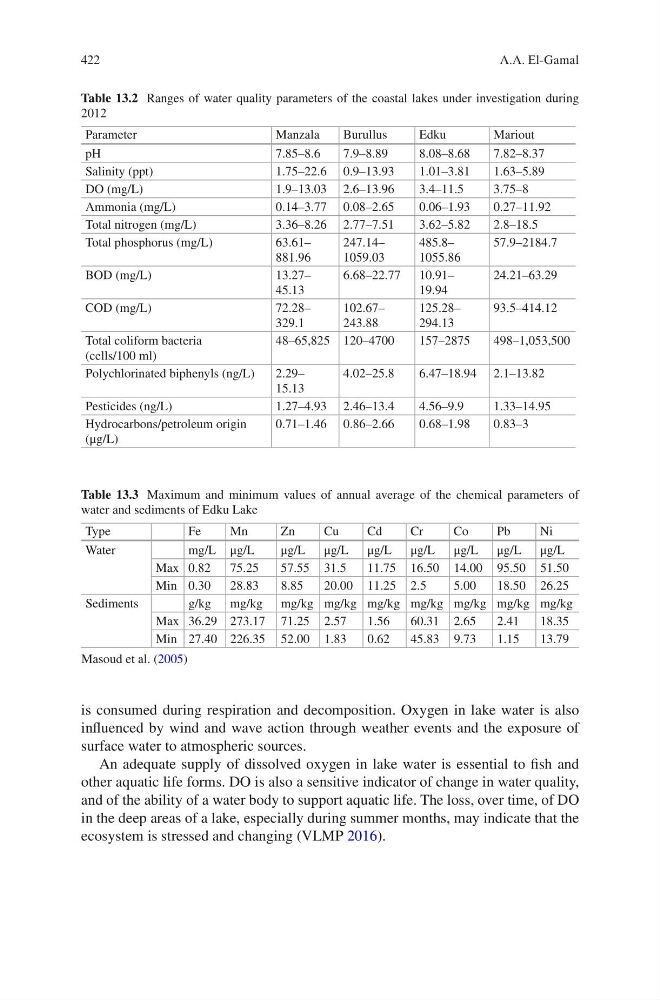
Table 13.2 Ranges of water quality parameters of the coastal lakes under investigation during
2012
Parameter
Manzala
Burullus
Edku
Mariout
pH
7.85–8.6
7.9–8.89
8.08–8.68
7.82–8.37
Salinity (ppt)
1.75–22.6 0.9–13.93
1.01–3.81
1.63–5.89
DO (mg/L)
1.9–13.03 2.6–13.96
3.4–11.5
3.75–8
Ammonia (mg/L)
0.14–3.77 0.08–2.65
0.06–1.93
0.27–11.92
Total nitrogen (mg/L)
3.36–8.26 2.77–7.51
3.62–5.82
2.8–18.5
Total phosphorus (mg/L)
63.61–
881.96
247.14–
1059.03
485.8–
1055.86
57.9–2184.7
BOD (mg/L)
13.27–
45.13
6.68–22.77 10.91–
19.94
24.21–63.29
COD (mg/L)
72.28–
329.1
102.67–
243.88
125.28–
294.13
93.5–414.12
Total coliform bacteria
(cells/100 ml)
48–65,825 120–4700
157–2875
498–1,053,500
Polychlorinated biphenyls (ng/L)
2.29–
15.13
4.02–25.8
6.47–18.94 2.1–13.82
Pesticides (ng/L)
1.27–4.93 2.46–13.4
4.56–9.9
1.33–14.95
Hydrocarbons/petroleum origin
(μg/L)
0.71–1.46 0.86–2.66
0.68–1.98
0.83–3
Table 13.3 Maximum and minimum values of annual average of the chemical parameters of
water and sediments of Edku Lake
Type
Fe
Mn
Zn
Cu
Cd
Cr
Co
Pb
Ni
Water
mg/L μg/L
μg/L μg/L μg/L μg/L μg/L μg/L μg/L
Max 0.82
75.25
57.55 31.5
11.75 16.50 14.00 95.50 51.50
Min 0.30
28.83
8.85
20.00 11.25 2.5
5.00
18.50 26.25
Sediments
g/kg mg/kg mg/kg mg/kg mg/kg mg/kg mg/kg mg/kg mg/kg
Max 36.29 273.17 71.25 2.57
1.56
60.31 2.65
2.41
18.35
Min 27.40 226.35 52.00 1.83
0.62
45.83 9.73
1.15
13.79
Masoud et al. (2005)
A.A. El-Gamal
is consumed during respiration and decomposition. Oxygen in lake water is also
influenced by wind and wave action through weather events and the exposure of
surface water to atmospheric sources.
An adequate supply of dissolved oxygen in lake water is essential to fish and
other aquatic life forms. DO is also a sensitive indicator of change in water quality,
and of the ability of a water body to support aquatic life. The loss, over time, of DO
in the deep areas of a lake, especially during summer months, may indicate that the
ecosystem is stressed and changing (VLMP 2016).
Table 13.2 Ranges of water quality parameters of the coastal lakes under investigation during
2012
Parameter
Manzala
Burullus
Edku
Mariout
pH
7.85–8.6
7.9–8.89
8.08–8.68
7.82–8.37
Salinity (ppt)
1.75–22.6 0.9–13.93
1.01–3.81
1.63–5.89
DO (mg/L)
1.9–13.03 2.6–13.96
3.4–11.5
3.75–8
Ammonia (mg/L)
0.14–3.77 0.08–2.65
0.06–1.93
0.27–11.92
Total nitrogen (mg/L)
3.36–8.26 2.77–7.51
3.62–5.82
2.8–18.5
Total phosphorus (mg/L)
63.61–
881.96
247.14–
1059.03
485.8–
1055.86
57.9–2184.7
BOD (mg/L)
13.27–
45.13
6.68–22.77 10.91–
19.94
24.21–63.29
COD (mg/L)
72.28–
329.1
102.67–
243.88
125.28–
294.13
93.5–414.12
Total coliform bacteria
(cells/100 ml)
48–65,825 120–4700
157–2875
498–1,053,500
Polychlorinated biphenyls (ng/L)
2.29–
15.13
4.02–25.8
6.47–18.94 2.1–13.82
Pesticides (ng/L)
1.27–4.93 2.46–13.4
4.56–9.9
1.33–14.95
Hydrocarbons/petroleum origin
(μg/L)
0.71–1.46 0.86–2.66
0.68–1.98
0.83–3
Table 13.3 Maximum and minimum values of annual average of the chemical parameters of
water and sediments of Edku Lake
Type
Fe
Mn
Zn
Cu
Cd
Cr
Co
Pb
Ni
Water
mg/L μg/L
μg/L μg/L μg/L μg/L μg/L μg/L μg/L
Max 0.82
75.25
57.55 31.5
11.75 16.50 14.00 95.50 51.50
Min 0.30
28.83
8.85
20.00 11.25 2.5
5.00
18.50 26.25
Sediments
g/kg mg/kg mg/kg mg/kg mg/kg mg/kg mg/kg mg/kg mg/kg
Max 36.29 273.17 71.25 2.57
1.56
60.31 2.65
2.41
18.35
Min 27.40 226.35 52.00 1.83
0.62
45.83 9.73
1.15
13.79
Masoud et al. (2005)
A.A. El-Gamal