

385
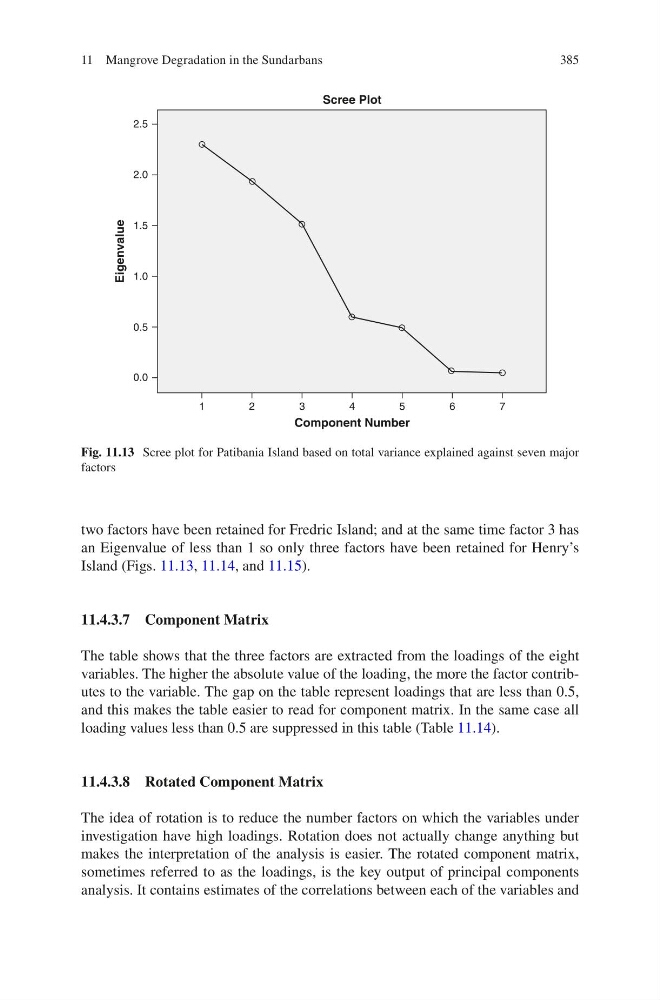
two factors have been retained for Fredric Island; and at the same time factor 3 has
an Eigenvalue of less than 1 so only three factors have been retained for Henry’s
Island (Figs. 11.13, 11.14, and 11.15).
11.4.3.7 Component Matrix
The table shows that the three factors are extracted from the loadings of the eight
variables. The higher the absolute value of the loading, the more the factor contributes to the variable. The gap on the table represent loadings that are less than 0.5,
and this makes the table easier to read for component matrix. In the same case all
loading values less than 0.5 are suppressed in this table (Table 11.14).
11.4.3.8 Rotated Component Matrix
The idea of rotation is to reduce the number factors on which the variables under
investigation have high loadings. Rotation does not actually change anything but
makes the interpretation of the analysis is easier. The rotated component matrix,
sometimes referred to as the loadings, is the key output of principal components
analysis. It contains estimates of the correlations between each of the variables and
2.5
2.0
1.5
1.0
0.5
0.0
1
2
3
4
Component Number
Scree Plot
Eigenvalue
5
6
7
Fig. 11.13 Scree plot for Patibania Island based on total variance explained against seven major
factors
11 Mangrove Degradation in the Sundarbans
two factors have been retained for Fredric Island; and at the same time factor 3 has
an Eigenvalue of less than 1 so only three factors have been retained for Henry’s
Island (Figs. 11.13, 11.14, and 11.15).
11.4.3.7 Component Matrix
The table shows that the three factors are extracted from the loadings of the eight
variables. The higher the absolute value of the loading, the more the factor contributes to the variable. The gap on the table represent loadings that are less than 0.5,
and this makes the table easier to read for component matrix. In the same case all
loading values less than 0.5 are suppressed in this table (Table 11.14).
11.4.3.8 Rotated Component Matrix
The idea of rotation is to reduce the number factors on which the variables under
investigation have high loadings. Rotation does not actually change anything but
makes the interpretation of the analysis is easier. The rotated component matrix,
sometimes referred to as the loadings, is the key output of principal components
analysis. It contains estimates of the correlations between each of the variables and
2.5
2.0
1.5
1.0
0.5
0.0
1
2
3
4
Component Number
Scree Plot
Eigenvalue
5
6
7
Fig. 11.13 Scree plot for Patibania Island based on total variance explained against seven major
factors
11 Mangrove Degradation in the Sundarbans