

381
11.4.3.5 Total Variance Explained
The variations of all the factors are extracted from the analysis along with their
Eigenvalues. The percent of variance attributable to each factor, and the cumulative
variance of the factor with the previous factors are added on the basis of Eigenvalues.
It is noticed that the first factor accounts for 32.872% of the variance, the second
one is 27.635% and the third one is 21.686% of Patibania Island. Whereas, in the
case of Fredric Island it is noticed that the first factor accounts for 39.195% of the
variance, the second one is 29.534% and the third one is 17.886%; and for Henry’s
Island the first factor accounts for 37.396% of the variance, the second one is
27.747% and the third one is 20.680%. All the remaining factors are not significant.
The numbers of rows in this panel of the table correspond to the number of factors
retained. In this study, it is requested to retain the three factors, so there are three
rows, in which one for each is retained as a factor. The values in this panel of the
table are calculated in the same way as the values in the left panel, except that here
the values are based on the common variance. The values in this panel of the table
will always be lower than the values in the left panel of the table, because they are
based on the common variance, which is always smaller than the total variance
(Tables 11.11, 11.12, and 11.13).
11.4.3.6 Scree Plot
The scree plot is a graph of the Eigenvalues against all the factors consider for such
experiment. The graph is useful for determination of factors that will retain with the
experiment. The point of interest is where the curve starts to flatten in the Scree plot
for each island. It can be seen that the curve begins to flatten between factors 3, 4, 5
and 6 for Patibania Island, 4 and 5 for Fredric Island, and 3 and 4 for Henry’s Island.
It is also noticed that, factor 3 has an Eigenvalue of less than 1 so only one factor has
been retained for Patibania Island; factor 4 has an Eigenvalue of less than 1 so only
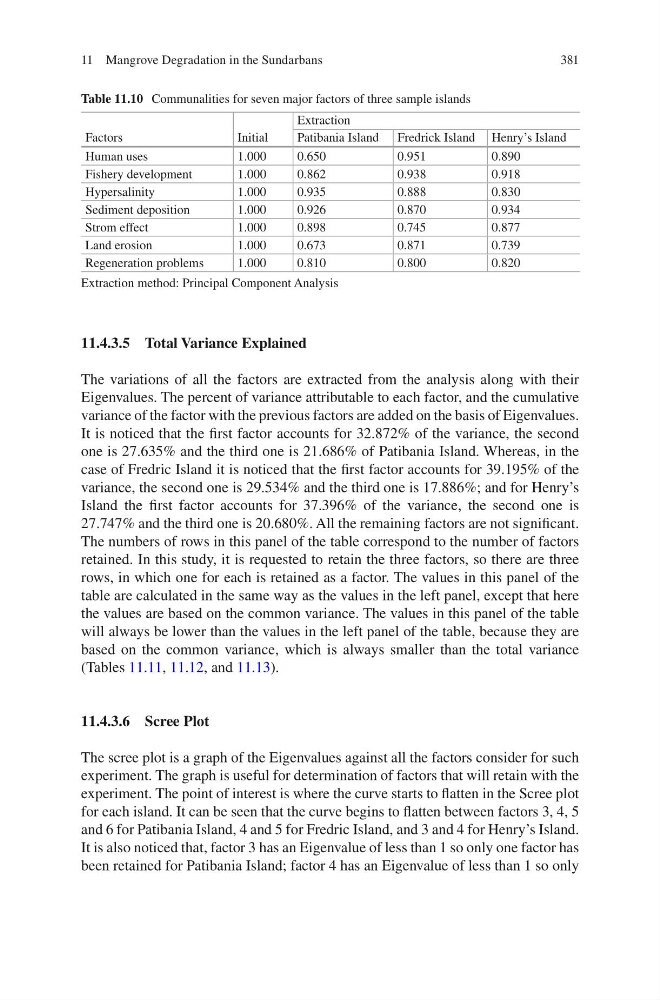
Table 11.10 Communalities for seven major factors of three sample islands
Factors
Initial
Extraction
Patibania Island Fredrick Island Henry’s Island
Human uses
1.000
0.650
0.951
0.890
Fishery development
1.000
0.862
0.938
0.918
Hypersalinity
1.000
0.935
0.888
0.830
Sediment deposition
1.000
0.926
0.870
0.934
Strom effect
1.000
0.898
0.745
0.877
Land erosion
1.000
0.673
0.871
0.739
Regeneration problems
1.000
0.810
0.800
0.820
Extraction method: Principal Component Analysis
11 Mangrove Degradation in the Sundarbans
11.4.3.5 Total Variance Explained
The variations of all the factors are extracted from the analysis along with their
Eigenvalues. The percent of variance attributable to each factor, and the cumulative
variance of the factor with the previous factors are added on the basis of Eigenvalues.
It is noticed that the first factor accounts for 32.872% of the variance, the second
one is 27.635% and the third one is 21.686% of Patibania Island. Whereas, in the
case of Fredric Island it is noticed that the first factor accounts for 39.195% of the
variance, the second one is 29.534% and the third one is 17.886%; and for Henry’s
Island the first factor accounts for 37.396% of the variance, the second one is
27.747% and the third one is 20.680%. All the remaining factors are not significant.
The numbers of rows in this panel of the table correspond to the number of factors
retained. In this study, it is requested to retain the three factors, so there are three
rows, in which one for each is retained as a factor. The values in this panel of the
table are calculated in the same way as the values in the left panel, except that here
the values are based on the common variance. The values in this panel of the table
will always be lower than the values in the left panel of the table, because they are
based on the common variance, which is always smaller than the total variance
(Tables 11.11, 11.12, and 11.13).
11.4.3.6 Scree Plot
The scree plot is a graph of the Eigenvalues against all the factors consider for such
experiment. The graph is useful for determination of factors that will retain with the
experiment. The point of interest is where the curve starts to flatten in the Scree plot
for each island. It can be seen that the curve begins to flatten between factors 3, 4, 5
and 6 for Patibania Island, 4 and 5 for Fredric Island, and 3 and 4 for Henry’s Island.
It is also noticed that, factor 3 has an Eigenvalue of less than 1 so only one factor has
been retained for Patibania Island; factor 4 has an Eigenvalue of less than 1 so only
Table 11.10 Communalities for seven major factors of three sample islands
Factors
Initial
Extraction
Patibania Island Fredrick Island Henry’s Island
Human uses
1.000
0.650
0.951
0.890
Fishery development
1.000
0.862
0.938
0.918
Hypersalinity
1.000
0.935
0.888
0.830
Sediment deposition
1.000
0.926
0.870
0.934
Strom effect
1.000
0.898
0.745
0.877
Land erosion
1.000
0.673
0.871
0.739
Regeneration problems
1.000
0.810
0.800
0.820
Extraction method: Principal Component Analysis
11 Mangrove Degradation in the Sundarbans