

336
y = 0.0018x - 3.4094
R 2 = 0.8948
y = 0.0016x - 3.0937
R 2 = 0.917
0.08
0.09
0.10
0.11
0.12
0.13
0.14
0.15
0.16
0.17
0.18
0.08
0.09
0.10
0.11
0.12
0.13
0.14
0.15
0.16
0.17
0.18
1990
1995
2000
2005
2010
2015
Bay Range/Ocean Range (a
B /a
O )
Mean Spring Tidal Range
(MHWS-MLWS m)
Year
Spring Tidal Range
Bay Range/Ocean Range
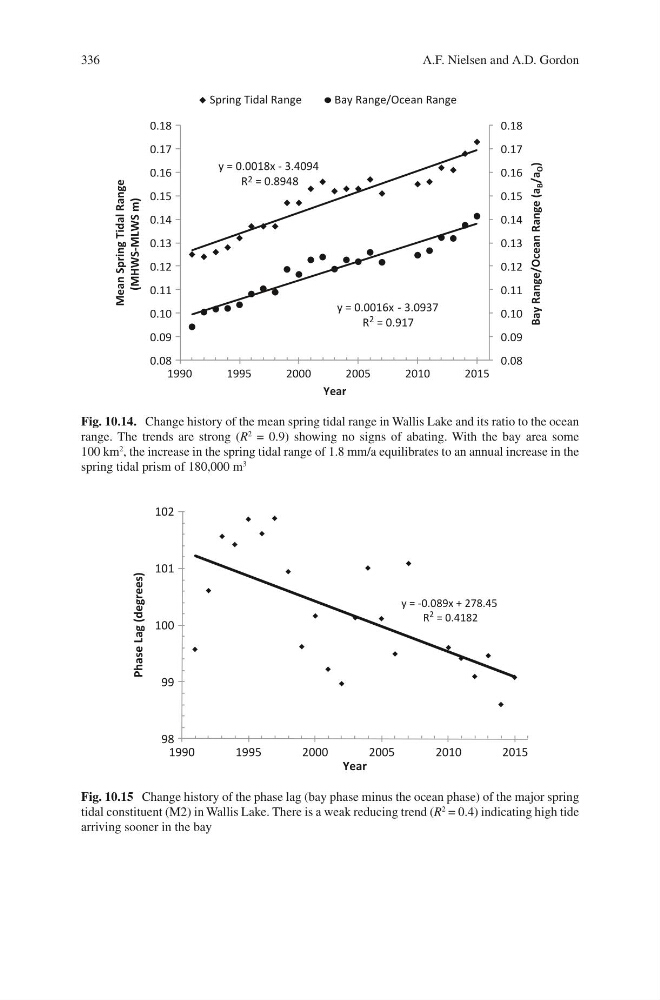
Fig. 10.14. Change history of the mean spring tidal range in Wallis Lake and its ratio to the ocean
range. The trends are strong (R
2 = 0.9) showing no signs of abating. With the bay area some
100 km
2 , the increase in the spring tidal range of 1.8 mm/a equilibrates to an annual increase in the
spring tidal prism of 180,000 m
3
y = -0.089x + 278.45
R
2 = 0.4182
98
99
100
101
102
1990
1995
2000
2005
2010
2015
Phase Lag (degrees)
Year
Fig. 10.15 Change history of the phase lag (bay phase minus the ocean phase) of the major spring
tidal constituent (M2) in Wallis Lake. There is a weak reducing trend (R
2 = 0.4) indicating high tide
arriving sooner in the bay
A.F. Nielsen and A.D. Gordon
y = 0.0018x - 3.4094
R 2 = 0.8948
y = 0.0016x - 3.0937
R 2 = 0.917
0.08
0.09
0.10
0.11
0.12
0.13
0.14
0.15
0.16
0.17
0.18
0.08
0.09
0.10
0.11
0.12
0.13
0.14
0.15
0.16
0.17
0.18
1990
1995
2000
2005
2010
2015
Bay Range/Ocean Range (a
B /a
O )
Mean Spring Tidal Range
(MHWS-MLWS m)
Year
Spring Tidal Range
Bay Range/Ocean Range
Fig. 10.14. Change history of the mean spring tidal range in Wallis Lake and its ratio to the ocean
range. The trends are strong (R
2 = 0.9) showing no signs of abating. With the bay area some
100 km
2 , the increase in the spring tidal range of 1.8 mm/a equilibrates to an annual increase in the
spring tidal prism of 180,000 m
3
y = -0.089x + 278.45
R
2 = 0.4182
98
99
100
101
102
1990
1995
2000
2005
2010
2015
Phase Lag (degrees)
Year
Fig. 10.15 Change history of the phase lag (bay phase minus the ocean phase) of the major spring
tidal constituent (M2) in Wallis Lake. There is a weak reducing trend (R
2 = 0.4) indicating high tide
arriving sooner in the bay
A.F. Nielsen and A.D. Gordon