

306
values, the waves during this time changes its direction so that only reach maximum
wave heights of 0.6 m and a minimum of up to 0.1 m (Fig. 9.24b).
9.5.6 Hydromorphological Modelling
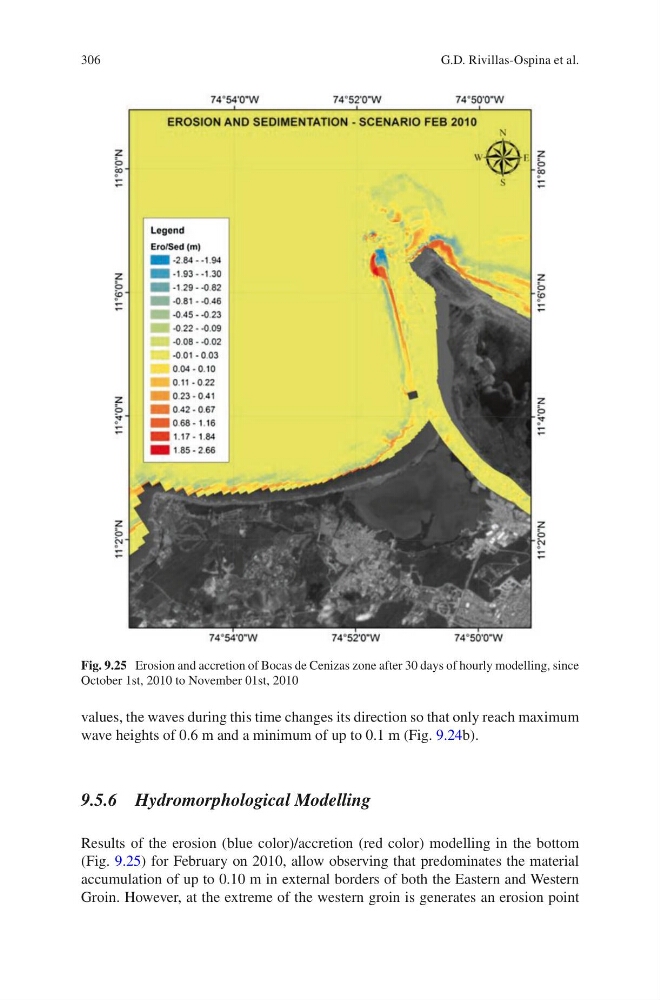
Results of the erosion (blue color)/accretion (red color) modelling in the bottom
(Fig. 9.25) for February on 2010, allow observing that predominates the material
accumulation of up to 0.10 m in external borders of both the Eastern and Western
Groin. However, at the extreme of the western groin is generates an erosion point
Fig. 9.25 Erosion and accretion of Bocas de Cenizas zone after 30 days of hourly modelling, since
October 1st, 2010 to November 01st, 2010
G.D. Rivillas-Ospina et al.
values, the waves during this time changes its direction so that only reach maximum
wave heights of 0.6 m and a minimum of up to 0.1 m (Fig. 9.24b).
9.5.6 Hydromorphological Modelling
Results of the erosion (blue color)/accretion (red color) modelling in the bottom
(Fig. 9.25) for February on 2010, allow observing that predominates the material
accumulation of up to 0.10 m in external borders of both the Eastern and Western
Groin. However, at the extreme of the western groin is generates an erosion point
Fig. 9.25 Erosion and accretion of Bocas de Cenizas zone after 30 days of hourly modelling, since
October 1st, 2010 to November 01st, 2010
G.D. Rivillas-Ospina et al.