

304
9.5.5 Humid Season: October
9.5.5.1 Currents
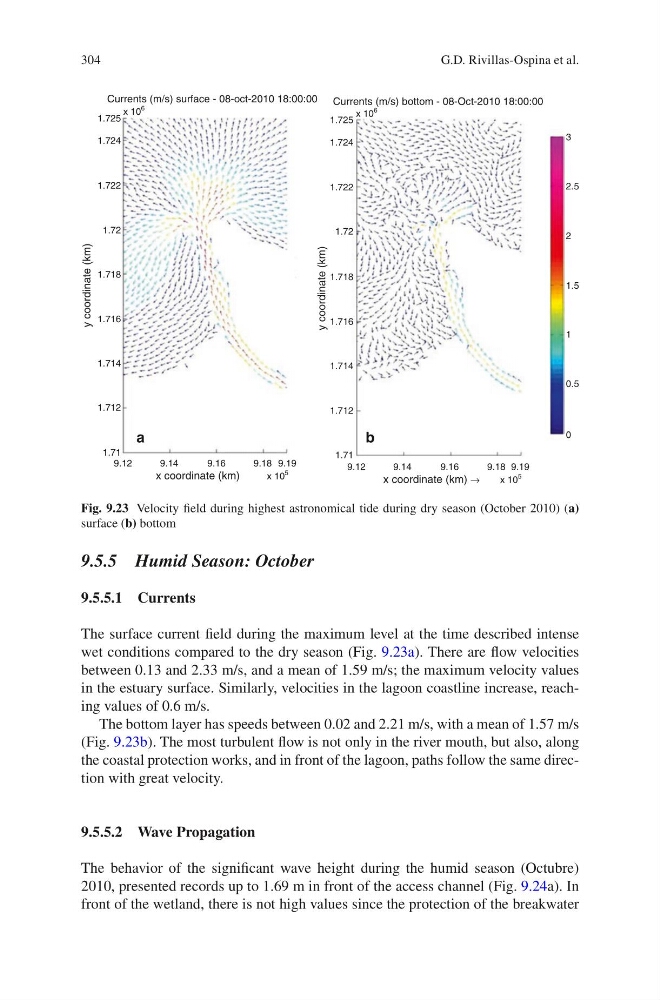
The surface current field during the maximum level at the time described intense
wet conditions compared to the dry season (Fig. 9.23a). There are flow velocities
between 0.13 and 2.33 m/s, and a mean of 1.59 m/s; the maximum velocity values
in the estuary surface. Similarly, velocities in the lagoon coastline increase, reaching values of 0.6 m/s.
The bottom layer has speeds between 0.02 and 2.21 m/s, with a mean of 1.57 m/s
(Fig. 9.23b). The most turbulent flow is not only in the river mouth, but also, along
the coastal protection works, and in front of the lagoon, paths follow the same direction with great velocity.
9.5.5.2 Wave Propagation
The behavior of the significant wave height during the humid season (Octubre)
2010, presented records up to 1.69 m in front of the access channel (Fig. 9.24a). In
front of the wetland, there is not high values since the protection of the breakwater
Currents (m/s) surface - 08-oct-2010 18:00:00 Currents (m/s) bottom - 08-Oct-2010 18:00:00
x coordinate (km)
x coordinate (km) →
y coordinate (km)
y coordinate (km)
1.71
9.12
9.14
9.16
9.18 9.19
1.712
1.714
1.716
1.718
1.72
1.722
1.724
1.725
1.71
1.712
1.714
1.716
1.718
1.72
1.722
1.724
1.725
3
2
1
2.5
1.5
0.5
0
x 10
6
x 10
6
x 10
5
9.12
9.14
9.16
9.18 9.19
x 10
5
a
b
Fig. 9.23 Velocity field during highest astronomical tide during dry season (October 2010) (a)
surface (b) bottom
G.D. Rivillas-Ospina et al.
9.5.5 Humid Season: October
9.5.5.1 Currents
The surface current field during the maximum level at the time described intense
wet conditions compared to the dry season (Fig. 9.23a). There are flow velocities
between 0.13 and 2.33 m/s, and a mean of 1.59 m/s; the maximum velocity values
in the estuary surface. Similarly, velocities in the lagoon coastline increase, reaching values of 0.6 m/s.
The bottom layer has speeds between 0.02 and 2.21 m/s, with a mean of 1.57 m/s
(Fig. 9.23b). The most turbulent flow is not only in the river mouth, but also, along
the coastal protection works, and in front of the lagoon, paths follow the same direction with great velocity.
9.5.5.2 Wave Propagation
The behavior of the significant wave height during the humid season (Octubre)
2010, presented records up to 1.69 m in front of the access channel (Fig. 9.24a). In
front of the wetland, there is not high values since the protection of the breakwater
Currents (m/s) surface - 08-oct-2010 18:00:00 Currents (m/s) bottom - 08-Oct-2010 18:00:00
x coordinate (km)
x coordinate (km) →
y coordinate (km)
y coordinate (km)
1.71
9.12
9.14
9.16
9.18 9.19
1.712
1.714
1.716
1.718
1.72
1.722
1.724
1.725
1.71
1.712
1.714
1.716
1.718
1.72
1.722
1.724
1.725
3
2
1
2.5
1.5
0.5
0
x 10
6
x 10
6
x 10
5
9.12
9.14
9.16
9.18 9.19
x 10
5
a
b
Fig. 9.23 Velocity field during highest astronomical tide during dry season (October 2010) (a)
surface (b) bottom
G.D. Rivillas-Ospina et al.