

290
In physical terms, this procedures allows to verify whether the consideration of
percentiles 16 and 84 in the analysis of sediment properties, the volume distribution
of the sand sample is symmetrical, whereas if we want to know how is the symmetry
behavior and the continuity in the distribution extremes, the analysis must be performed for percentiles 5 and 95 (Inman 1952). It is vital to consider in the analysis
other significant points in the cumulative curve of the sediment distribution in terms
of ϕ, simplifying with this the original mechanical analysis of sediment, these are:
∅ 5 , ∅ 16 , ∅ 50 , ∅ 84 , ∅ 95
The theoretical formulations to determine the statistical behavior of the data in
Phi units are:
f = - log 2 d
(9.1)
d =
-
2
f
(9.2)
d: diameter of the sediment particle in millimetres.
ϕ: Phi units.
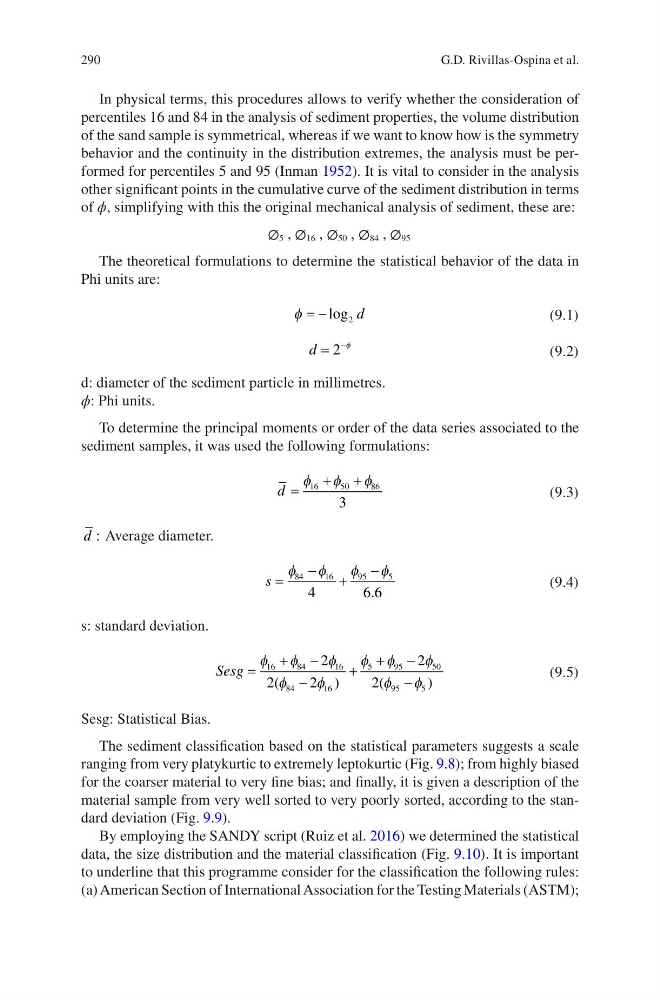
To determine the principal moments or order of the data series associated to the
sediment samples, it was used the following formulations:
d =
+
+
f f f
16
50
86
3
(9.3)
d : Average diameter.
s =
-
+
-
f f
f f
84
16
95
5
4
66 .
(9.4)
s: standard deviation.
Sesg =
+ -
-
+
+ -
-
f f
f
f
f
f f
f
f f
16
84
16
84
16
5
9 5
5 0
95
5
2
2
2
2
2
(
)
(
)
(9.5)
Sesg: Statistical Bias.
The sediment classification based on the statistical parameters suggests a scale
ranging from very platykurtic to extremely leptokurtic (Fig. 9.8); from highly biased
for the coarser material to very fine bias; and finally, it is given a description of the
material sample from very well sorted to very poorly sorted, according to the standard deviation (Fig. 9.9).
By employing the SANDY script (Ruiz et al. 2016) we determined the statistical
data, the size distribution and the material classification (Fig. 9.10). It is important
to underline that this programme consider for the classification the following rules:
(a) American Section of International Association for the Testing Materials (ASTM);
G.D. Rivillas-Ospina et al.
In physical terms, this procedures allows to verify whether the consideration of
percentiles 16 and 84 in the analysis of sediment properties, the volume distribution
of the sand sample is symmetrical, whereas if we want to know how is the symmetry
behavior and the continuity in the distribution extremes, the analysis must be performed for percentiles 5 and 95 (Inman 1952). It is vital to consider in the analysis
other significant points in the cumulative curve of the sediment distribution in terms
of ϕ, simplifying with this the original mechanical analysis of sediment, these are:
∅ 5 , ∅ 16 , ∅ 50 , ∅ 84 , ∅ 95
The theoretical formulations to determine the statistical behavior of the data in
Phi units are:
f = - log 2 d
(9.1)
d =
-
2
f
(9.2)
d: diameter of the sediment particle in millimetres.
ϕ: Phi units.
To determine the principal moments or order of the data series associated to the
sediment samples, it was used the following formulations:
d =
+
+
f f f
16
50
86
3
(9.3)
d : Average diameter.
s =
-
+
-
f f
f f
84
16
95
5
4
66 .
(9.4)
s: standard deviation.
Sesg =
+ -
-
+
+ -
-
f f
f
f
f
f f
f
f f
16
84
16
84
16
5
9 5
5 0
95
5
2
2
2
2
2
(
)
(
)
(9.5)
Sesg: Statistical Bias.
The sediment classification based on the statistical parameters suggests a scale
ranging from very platykurtic to extremely leptokurtic (Fig. 9.8); from highly biased
for the coarser material to very fine bias; and finally, it is given a description of the
material sample from very well sorted to very poorly sorted, according to the standard deviation (Fig. 9.9).
By employing the SANDY script (Ruiz et al. 2016) we determined the statistical
data, the size distribution and the material classification (Fig. 9.10). It is important
to underline that this programme consider for the classification the following rules:
(a) American Section of International Association for the Testing Materials (ASTM);
G.D. Rivillas-Ospina et al.