

256
the MSL during El Niño is therefore comparable to the raising that would be
observed by the end of the century.
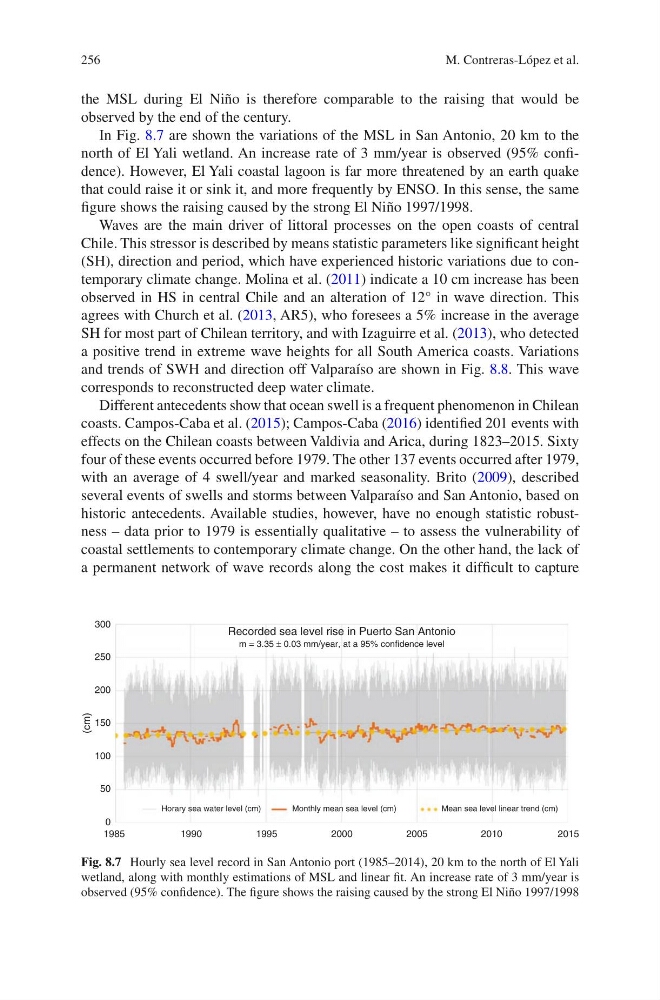
In Fig. 8.7 are shown the variations of the MSL in San Antonio, 20 km to the
north of El Yali wetland. An increase rate of 3 mm/year is observed (95% confidence). However, El Yali coastal lagoon is far more threatened by an earth quake
that could raise it or sink it, and more frequently by ENSO. In this sense, the same
figure shows the raising caused by the strong El Niño 1997/1998.
Waves are the main driver of littoral processes on the open coasts of central
Chile. This stressor is described by means statistic parameters like significant height
(SH), direction and period, which have experienced historic variations due to contemporary climate change. Molina et al. (2011) indicate a 10 cm increase has been
observed in HS in central Chile and an alteration of 12° in wave direction. This
agrees with Church et al. (2013, AR5), who foresees a 5% increase in the average
SH for most part of Chilean territory, and with Izaguirre et al. (2013), who detected
a positive trend in extreme wave heights for all South America coasts. Variations
and trends of SWH and direction off Valparaíso are shown in Fig. 8.8. This wave
corresponds to reconstructed deep water climate.
Different antecedents show that ocean swell is a frequent phenomenon in Chilean
coasts. Campos-Caba et al. (2015); Campos-Caba (2016) identified 201 events with
effects on the Chilean coasts between Valdivia and Arica, during 1823–2015. Sixty
four of these events occurred before 1979. The other 137 events occurred after 1979,
with an average of 4 swell/year and marked seasonality. Brito (2009), described
several events of swells and storms between Valparaíso and San Antonio, based on
historic antecedents. Available studies, however, have no enough statistic robustness – data prior to 1979 is essentially qualitative – to assess the vulnerability of
coastal settlements to contemporary climate change. On the other hand, the lack of
a permanent network of wave records along the cost makes it difficult to capture
300
250
200
150
100
(cm)
50
0
1985
1990
1995
2000
2005
2010
2015
Horary sea water level (cm)
Monthly mean sea level (cm)
M ean sea level linear trend (cm)
Recorded sea level rise in Puerto San Antonio
m = 3.35 ± 0.03 mm/year, at a 95% confidence level
Fig. 8.7 Hourly sea level record in San Antonio port (1985–2014), 20 km to the north of El Yali
wetland, along with monthly estimations of MSL and linear fit. An increase rate of 3 mm/year is
observed (95% confidence). The figure shows the raising caused by the strong El Niño 1997/1998
M. Contreras-López et al.
the MSL during El Niño is therefore comparable to the raising that would be
observed by the end of the century.
In Fig. 8.7 are shown the variations of the MSL in San Antonio, 20 km to the
north of El Yali wetland. An increase rate of 3 mm/year is observed (95% confidence). However, El Yali coastal lagoon is far more threatened by an earth quake
that could raise it or sink it, and more frequently by ENSO. In this sense, the same
figure shows the raising caused by the strong El Niño 1997/1998.
Waves are the main driver of littoral processes on the open coasts of central
Chile. This stressor is described by means statistic parameters like significant height
(SH), direction and period, which have experienced historic variations due to contemporary climate change. Molina et al. (2011) indicate a 10 cm increase has been
observed in HS in central Chile and an alteration of 12° in wave direction. This
agrees with Church et al. (2013, AR5), who foresees a 5% increase in the average
SH for most part of Chilean territory, and with Izaguirre et al. (2013), who detected
a positive trend in extreme wave heights for all South America coasts. Variations
and trends of SWH and direction off Valparaíso are shown in Fig. 8.8. This wave
corresponds to reconstructed deep water climate.
Different antecedents show that ocean swell is a frequent phenomenon in Chilean
coasts. Campos-Caba et al. (2015); Campos-Caba (2016) identified 201 events with
effects on the Chilean coasts between Valdivia and Arica, during 1823–2015. Sixty
four of these events occurred before 1979. The other 137 events occurred after 1979,
with an average of 4 swell/year and marked seasonality. Brito (2009), described
several events of swells and storms between Valparaíso and San Antonio, based on
historic antecedents. Available studies, however, have no enough statistic robustness – data prior to 1979 is essentially qualitative – to assess the vulnerability of
coastal settlements to contemporary climate change. On the other hand, the lack of
a permanent network of wave records along the cost makes it difficult to capture
300
250
200
150
100
(cm)
50
0
1985
1990
1995
2000
2005
2010
2015
Horary sea water level (cm)
Monthly mean sea level (cm)
M ean sea level linear trend (cm)
Recorded sea level rise in Puerto San Antonio
m = 3.35 ± 0.03 mm/year, at a 95% confidence level
Fig. 8.7 Hourly sea level record in San Antonio port (1985–2014), 20 km to the north of El Yali
wetland, along with monthly estimations of MSL and linear fit. An increase rate of 3 mm/year is
observed (95% confidence). The figure shows the raising caused by the strong El Niño 1997/1998
M. Contreras-López et al.