

254
coherent with ENSO. Moreover, sharp oscillations in precipitations are observed but
they are not always related to the ONI, as what was observed between 2001 and 2002.
Time series of Maipo river discharge at its mouth (20 km north of El Yali) is
shown in Fig. 8.6. It is observed that the historic average of 200 m
3
s
−1
is exceeded
many times, mostly associated to El Niño. The higher swellings correspond to years
1987/1988 and 2002/2003, which do not correspond to intense ENSO events. On
the other hand, ENSO 1982/1983 and 1997/1998 have associated important swellings but not as severe as those observed during 1987/1988 y 2002/2003.
The mean se level (MSL) has increase during the recent decades due to the
effects of thermic expansion and glacier, ice caps and polar ice melting. According
to the IPCC (Magrin et al. 2014), the global mean sea level rose 0.19 m (0.17–0.21
m) during 1901–2010 and it is expected an increase of 0.26–0.82 during 2081–
2100. In Chile, however, this variation is conditioned by the seismic activity between
Nazca and South America plates. An analysis of 60 years records along Chile
(Contreras et al. 2012) indicates that mean sea level variations significantly differ
along Chile. In northern Chile, the MSL is decreasing at −1.4 mm/year (Arica,
northernmost extreme of Chile), whereas in the center-south region the MSL is
increasing at a rate of 2.2 mm/year (Puerto Williams, southernmost extreme of
Chile). Predictions of conservative climate change scenarios for 2100 indicate a
MSL rise between 0.2 and 0.3 m for different latitudes along the country; values that
coincide with rates estimated by CEPAL (2015) and IPCC report (Magrin et al.
2014). By using numerical models, Albrecht and Shaffer (2016) Project MSL
increase of 34–52 cm for RCP4.5 and 46–74 cm for RCP8.5 by the end of the
twenty-first century.
3
2
1
-1
-2
-3
0
3
2
1
-1
-2
-3
0
3
2
1
-1
-2
-3
0
1995
1970
1970
1965
1960
1955
1950
1945
1975
1980
1985
1990
1995
2000
2005
2010
2015
SST anomaly at Valparaíso (°C)
EI Niño 3.4 Index
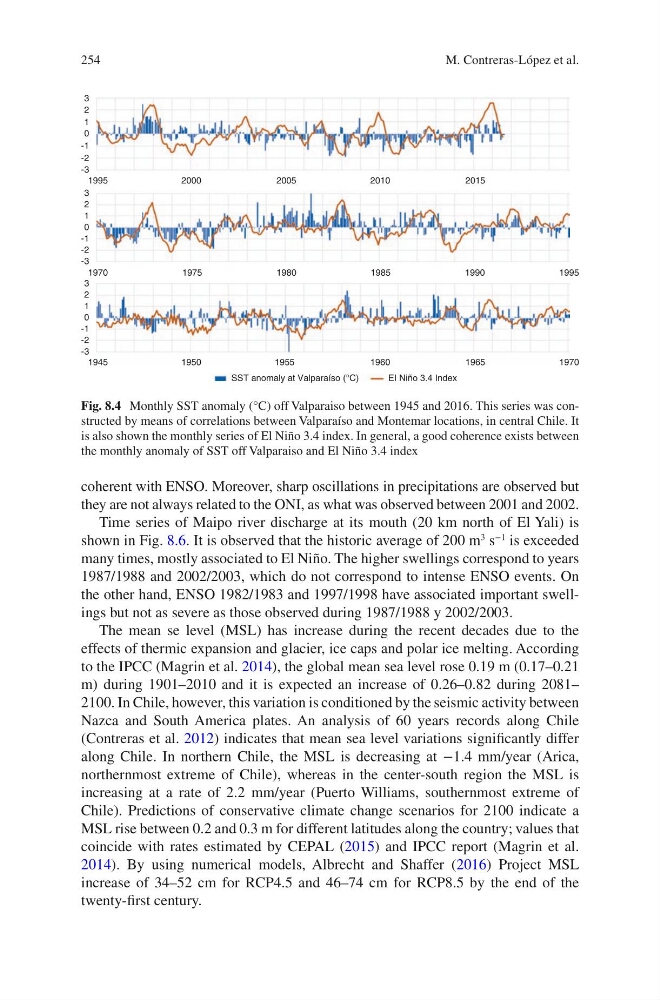
Fig. 8.4 Monthly SST anomaly (°C) off Valparaiso between 1945 and 2016. This series was constructed by means of correlations between Valparaíso and Montemar locations, in central Chile. It
is also shown the monthly series of El Niño 3.4 index. In general, a good coherence exists between
the monthly anomaly of SST off Valparaiso and El Niño 3.4 index
M. Contreras-López et al.
coherent with ENSO. Moreover, sharp oscillations in precipitations are observed but
they are not always related to the ONI, as what was observed between 2001 and 2002.
Time series of Maipo river discharge at its mouth (20 km north of El Yali) is
shown in Fig. 8.6. It is observed that the historic average of 200 m
3
s
−1
is exceeded
many times, mostly associated to El Niño. The higher swellings correspond to years
1987/1988 and 2002/2003, which do not correspond to intense ENSO events. On
the other hand, ENSO 1982/1983 and 1997/1998 have associated important swellings but not as severe as those observed during 1987/1988 y 2002/2003.
The mean se level (MSL) has increase during the recent decades due to the
effects of thermic expansion and glacier, ice caps and polar ice melting. According
to the IPCC (Magrin et al. 2014), the global mean sea level rose 0.19 m (0.17–0.21
m) during 1901–2010 and it is expected an increase of 0.26–0.82 during 2081–
2100. In Chile, however, this variation is conditioned by the seismic activity between
Nazca and South America plates. An analysis of 60 years records along Chile
(Contreras et al. 2012) indicates that mean sea level variations significantly differ
along Chile. In northern Chile, the MSL is decreasing at −1.4 mm/year (Arica,
northernmost extreme of Chile), whereas in the center-south region the MSL is
increasing at a rate of 2.2 mm/year (Puerto Williams, southernmost extreme of
Chile). Predictions of conservative climate change scenarios for 2100 indicate a
MSL rise between 0.2 and 0.3 m for different latitudes along the country; values that
coincide with rates estimated by CEPAL (2015) and IPCC report (Magrin et al.
2014). By using numerical models, Albrecht and Shaffer (2016) Project MSL
increase of 34–52 cm for RCP4.5 and 46–74 cm for RCP8.5 by the end of the
twenty-first century.
3
2
1
-1
-2
-3
0
3
2
1
-1
-2
-3
0
3
2
1
-1
-2
-3
0
1995
1970
1970
1965
1960
1955
1950
1945
1975
1980
1985
1990
1995
2000
2005
2010
2015
SST anomaly at Valparaíso (°C)
EI Niño 3.4 Index
Fig. 8.4 Monthly SST anomaly (°C) off Valparaiso between 1945 and 2016. This series was constructed by means of correlations between Valparaíso and Montemar locations, in central Chile. It
is also shown the monthly series of El Niño 3.4 index. In general, a good coherence exists between
the monthly anomaly of SST off Valparaiso and El Niño 3.4 index
M. Contreras-López et al.