

Composition and Dynamics of the Bird Community
357
25.3 Seasonal Variation in Bird Density and Diversity
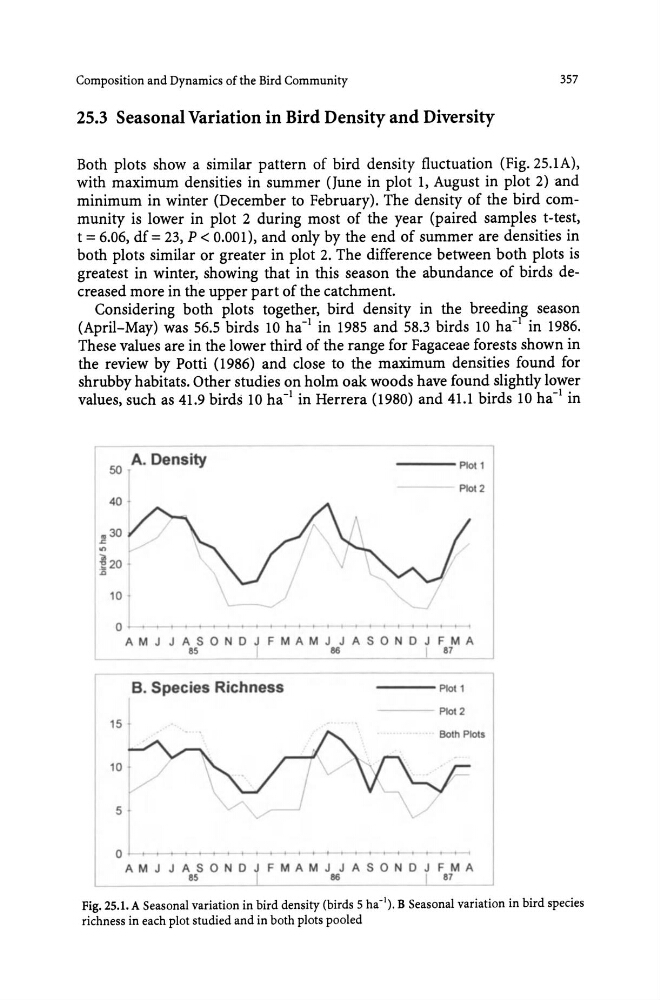
Both plots show a similar pattern of bird density fluctuation (Fig. 25.1A),
with maximum densities in summer (June in plot 1, August in plot 2) and
minimum in winter (December to February). The density of the bird community is lower in plot 2 during most of the year (paired samples t-test,
t = 6.06, df = 23, P < 0.001), and only by the end of summer are densities in
both plots similar or greater in plot 2. The difference between both plots is
greatest in winter, showing that in this season the abundance of birds decreased more in the upper part of the catchment.
Considering both plots together, bird density in the breeding season
(April-May) was 56.5 birds 10 ha- 1 in 1985 and 58.3 birds 10 ha- 1 in 1986.
These values are in the lower third of the range for Fagaceae forests shown in
the review by Potti (1986) and close to the maximum densities found for
shrubby habitats. Other studies on holm oak woods have found slightly lower
values, such as 41.9 birds 10 ha- 1 in Herrera (1980) and 41.1 birds 10 ha- 1 in
A. Density
so
40
.,30
.c
'"
~20
~
o
- - - - P l o t 1
Plot 2
A M J J A SON 0 J F M A M J J A SON 0 J F M A
~
~
v
r B. Species Richness
- - - - PIo11
15 1
PIo12
Both Plots
10 I
5
o
Fig. 25.1. A Seasonal variation in bird density (birds 5 ha-'). B Seasonal variation in bird species
richness in each plot studied and in both plots pooled
357
25.3 Seasonal Variation in Bird Density and Diversity
Both plots show a similar pattern of bird density fluctuation (Fig. 25.1A),
with maximum densities in summer (June in plot 1, August in plot 2) and
minimum in winter (December to February). The density of the bird community is lower in plot 2 during most of the year (paired samples t-test,
t = 6.06, df = 23, P < 0.001), and only by the end of summer are densities in
both plots similar or greater in plot 2. The difference between both plots is
greatest in winter, showing that in this season the abundance of birds decreased more in the upper part of the catchment.
Considering both plots together, bird density in the breeding season
(April-May) was 56.5 birds 10 ha- 1 in 1985 and 58.3 birds 10 ha- 1 in 1986.
These values are in the lower third of the range for Fagaceae forests shown in
the review by Potti (1986) and close to the maximum densities found for
shrubby habitats. Other studies on holm oak woods have found slightly lower
values, such as 41.9 birds 10 ha- 1 in Herrera (1980) and 41.1 birds 10 ha- 1 in
A. Density
so
40
.,30
.c
'"
~20
~
o
- - - - P l o t 1
Plot 2
A M J J A SON 0 J F M A M J J A SON 0 J F M A
~
~
v
r B. Species Richness
- - - - PIo11
15 1
PIo12
Both Plots
10 I
5
o
Fig. 25.1. A Seasonal variation in bird density (birds 5 ha-'). B Seasonal variation in bird species
richness in each plot studied and in both plots pooled