

350
Pilar Andres, Eduardo Mateos and Carlos Ascaso
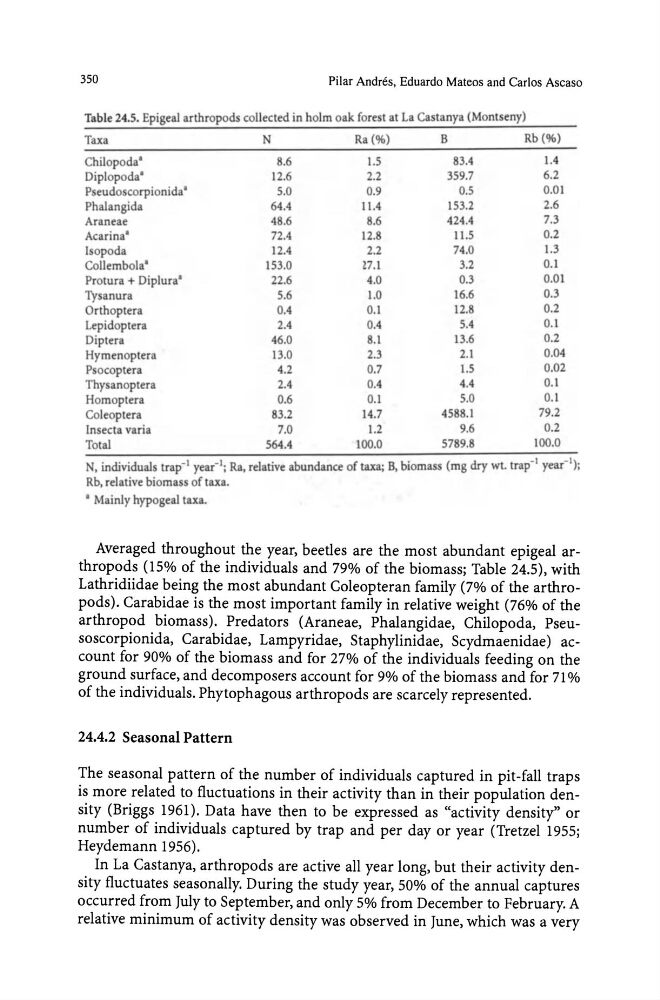
Table 24.S. Epigeal arthropods collected in holm oak forest at La Ca tanya (Montseny)
Taxa
N
Ra (%)
B
Rb (%)
Chilopoda'
8.6
1.5
83.4
1.4
Diplopoda'
12.6
2.2
359.7
6.2
Pseudoscorpionida"
5.0
0.9
0.5
0.01
Phalangida
64.4
11.4
153.2
2.6
Araneae
48.6
8.6
424.4
7.3
Acarina"
72.4
12.8
11.5
0.2
Isopoda
12.4
2.2
74.0
1.3
Collembola'
153.0
~7.l
3.2
0.1
Protura + Diplura"
22.6
4.0
0.3
0.01
Tysanura
5.6
1.0
16.6
0.3
Orthoptera
0.4
0.1
12.8
0.2
Lepidoptera
2.4
0.4
5.4
0.1
Diptera
46.0
8.1
13.6
0.2
Hymenoptera
13.0
2.3
2.1
0.04
Psocoptera
4.2
0.7
1.5
0.02
Thy anoptera
2.4
0.4
4.4
0.1
Homoptera
0.6
0.1
5.0
0.1
Coleoptera
83.2
14.7
4588.1
79.2
Insecta varia
7.0
1.2
9.6
0.2
Total
564.4
100.0
5789.8
100.0
, individuals trap-I year-I ; Ra, relative abundance of taxa; B, biomass (mg dry wl. trap- I year-I);
Rb, relative biomass of taxa.
I Mainly hypogeal taxa.
Averaged throughout the year, beetles are the most abundant epigeal arthropods (15% of the individuals and 79% of the biomass; Table 24.5), with
Lathridiidae being the most abundant Coleopteran family (7% of the arthropods). Carabidae is the most important family in relative weight (76% of the
arthropod biomass). Predators (Araneae, Phalangidae, Chilopoda, Pseuso scorpionida, Carabidae, Lampyridae, Staphylinidae, Scydmaenidae) account for 90% of the biomass and for 27% of the individuals feeding on the
ground surface, and decomposers account for 9% of the biomass and for 71 %
of the individuals. Phytophagous arthropods are scarcely represented.
24.4.2 Seasonal Pattern
The seasonal pattern of the number of individuals captured in pit-fall traps
is more related to fluctuations in their activity than in their population density (Briggs 1961). Data have then to be expressed as "activity density" or
number of individuals captured by trap and per day or year (Tretzel 1955;
Heydemann 1956).
In La Castanya, arthropods are active all year long, but their activity density fluctuates seasonally. During the study year, 50% of the annual captures
occurred from July to September, and only 5% from December to February. A
relative minimum of activity density was observed in June, which was a very
Pilar Andres, Eduardo Mateos and Carlos Ascaso
Table 24.S. Epigeal arthropods collected in holm oak forest at La Ca tanya (Montseny)
Taxa
N
Ra (%)
B
Rb (%)
Chilopoda'
8.6
1.5
83.4
1.4
Diplopoda'
12.6
2.2
359.7
6.2
Pseudoscorpionida"
5.0
0.9
0.5
0.01
Phalangida
64.4
11.4
153.2
2.6
Araneae
48.6
8.6
424.4
7.3
Acarina"
72.4
12.8
11.5
0.2
Isopoda
12.4
2.2
74.0
1.3
Collembola'
153.0
~7.l
3.2
0.1
Protura + Diplura"
22.6
4.0
0.3
0.01
Tysanura
5.6
1.0
16.6
0.3
Orthoptera
0.4
0.1
12.8
0.2
Lepidoptera
2.4
0.4
5.4
0.1
Diptera
46.0
8.1
13.6
0.2
Hymenoptera
13.0
2.3
2.1
0.04
Psocoptera
4.2
0.7
1.5
0.02
Thy anoptera
2.4
0.4
4.4
0.1
Homoptera
0.6
0.1
5.0
0.1
Coleoptera
83.2
14.7
4588.1
79.2
Insecta varia
7.0
1.2
9.6
0.2
Total
564.4
100.0
5789.8
100.0
, individuals trap-I year-I ; Ra, relative abundance of taxa; B, biomass (mg dry wl. trap- I year-I);
Rb, relative biomass of taxa.
I Mainly hypogeal taxa.
Averaged throughout the year, beetles are the most abundant epigeal arthropods (15% of the individuals and 79% of the biomass; Table 24.5), with
Lathridiidae being the most abundant Coleopteran family (7% of the arthropods). Carabidae is the most important family in relative weight (76% of the
arthropod biomass). Predators (Araneae, Phalangidae, Chilopoda, Pseuso scorpionida, Carabidae, Lampyridae, Staphylinidae, Scydmaenidae) account for 90% of the biomass and for 27% of the individuals feeding on the
ground surface, and decomposers account for 9% of the biomass and for 71 %
of the individuals. Phytophagous arthropods are scarcely represented.
24.4.2 Seasonal Pattern
The seasonal pattern of the number of individuals captured in pit-fall traps
is more related to fluctuations in their activity than in their population density (Briggs 1961). Data have then to be expressed as "activity density" or
number of individuals captured by trap and per day or year (Tretzel 1955;
Heydemann 1956).
In La Castanya, arthropods are active all year long, but their activity density fluctuates seasonally. During the study year, 50% of the annual captures
occurred from July to September, and only 5% from December to February. A
relative minimum of activity density was observed in June, which was a very