

Soil Fertility After Fire and Clear-Cutting
325
Immediately after the fire, the ashbed presented very low mineral N concentration (Fig. 22.4). The ash usually contains low quantities of mineral N
due to N volatilization during the fire (Raison et al. 1985b; Marion et al.
1991). Nevertheless, the H layer and top mineral soil increased their ammonium content as a direct consequence of mild heating during the fire which
promoted N mineralization (Kutiel and Shaviv 1989). No nitrate increase was
observed in the initial sampling after the fire. The ashbed increased the ammonium content during the following 6 months, but it then decreased. For all
the layers sampled, the peak in ammonium was followed by a peak in nitrate.
This behaviour was most clearly seen in the Hand ashbed layer, to a lesser
extent in the 0-5 cm mineral soil and was only slightly detectable in 5-10 cm
soil (Fig. 22.4). This delay in nitrification has been attributed to the sterilization of nitrifiers (Dunn et al. 1979) and their relatively slow recovery. The
peak in nitrification was reached faster in the clearcut than in the burned
plot. This was probably due to the improved moisture conditions and the
lack of sterilization in the clearcut plot. The second year after burning, the
burned and control plots . showed very similar behaviours for total mineral
nitrogen and its forms at each of the layers sampled.
22.6.3 Mineral Nitrogen Mobility
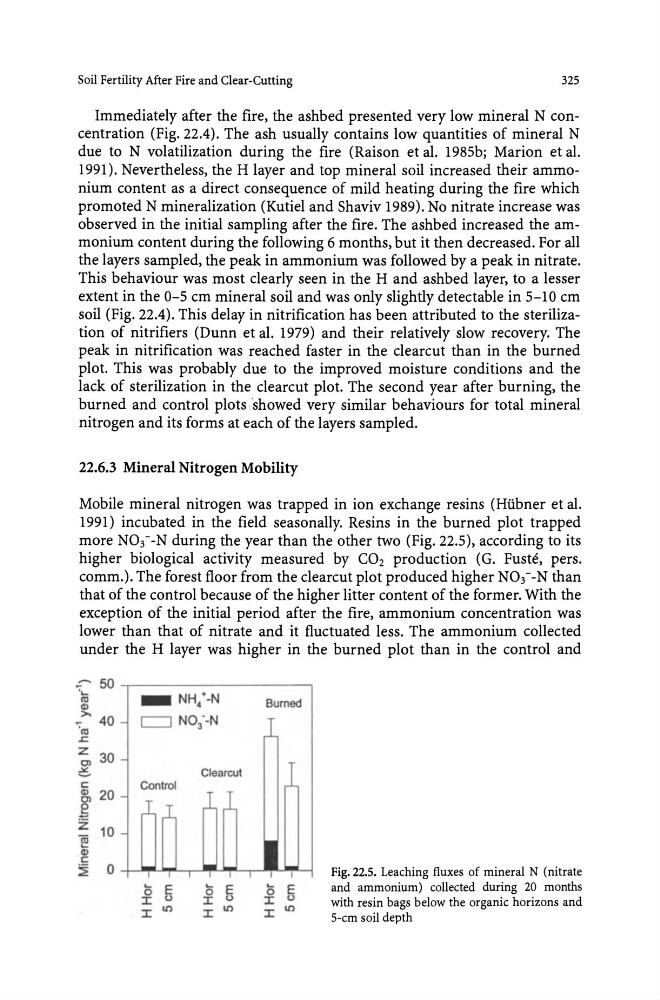
Mobile mineral nitrogen was trapped in ion exchange resins (Hubner et al.
1991) incubated in the field seasonally. Resins in the burned plot trapped
more N03--N during the year than the other two (Fig. 22.5), according to its
higher biological activity measured by CO2 production (G. Fuste, pers.
comm.). The forest floor from the clearcut plot produced higher N03 - -N than
that of the control because of the higher litter content of the former. With the
exception of the initial period after the fire, ammonium concentration was
lower than that of nitrate and it fluctuated less. The ammonium collected
under the H layer was higher in the burned plot than in the control and
~ 50 . , - - - - - - - - - - - ,
....
('0
Q)
.?' 40
'('0
.J::
Z 30
01
6
c::
Q)
20
g
Z 10
~
Q)
c
_
NH 4 • -N
Burned
C=:J NO; -N
Clearcul
Control
~
0 -I-........... --.-........ L....IiI!'II........ro E
I
U
I
I/')
o E
I
U
I
I/')
o E
I
U
I
I/')
Fig. 22.5. Leaching fluxes of mineral N (nitrate
and ammonium) collected during 20 months
with resin bags below the organic horizons and
5-cm soil depth
325
Immediately after the fire, the ashbed presented very low mineral N concentration (Fig. 22.4). The ash usually contains low quantities of mineral N
due to N volatilization during the fire (Raison et al. 1985b; Marion et al.
1991). Nevertheless, the H layer and top mineral soil increased their ammonium content as a direct consequence of mild heating during the fire which
promoted N mineralization (Kutiel and Shaviv 1989). No nitrate increase was
observed in the initial sampling after the fire. The ashbed increased the ammonium content during the following 6 months, but it then decreased. For all
the layers sampled, the peak in ammonium was followed by a peak in nitrate.
This behaviour was most clearly seen in the Hand ashbed layer, to a lesser
extent in the 0-5 cm mineral soil and was only slightly detectable in 5-10 cm
soil (Fig. 22.4). This delay in nitrification has been attributed to the sterilization of nitrifiers (Dunn et al. 1979) and their relatively slow recovery. The
peak in nitrification was reached faster in the clearcut than in the burned
plot. This was probably due to the improved moisture conditions and the
lack of sterilization in the clearcut plot. The second year after burning, the
burned and control plots . showed very similar behaviours for total mineral
nitrogen and its forms at each of the layers sampled.
22.6.3 Mineral Nitrogen Mobility
Mobile mineral nitrogen was trapped in ion exchange resins (Hubner et al.
1991) incubated in the field seasonally. Resins in the burned plot trapped
more N03--N during the year than the other two (Fig. 22.5), according to its
higher biological activity measured by CO2 production (G. Fuste, pers.
comm.). The forest floor from the clearcut plot produced higher N03 - -N than
that of the control because of the higher litter content of the former. With the
exception of the initial period after the fire, ammonium concentration was
lower than that of nitrate and it fluctuated less. The ammonium collected
under the H layer was higher in the burned plot than in the control and
~ 50 . , - - - - - - - - - - - ,
....
('0
Q)
.?' 40
'('0
.J::
Z 30
01
6
c::
Q)
20
g
Z 10
~
Q)
c
_
NH 4 • -N
Burned
C=:J NO; -N
Clearcul
Control
~
0 -I-........... --.-........ L....IiI!'II........ro E
I
U
I
I/')
o E
I
U
I
I/')
o E
I
U
I
I/')
Fig. 22.5. Leaching fluxes of mineral N (nitrate
and ammonium) collected during 20 months
with resin bags below the organic horizons and
5-cm soil depth