

Element Budgets in Catchments
289
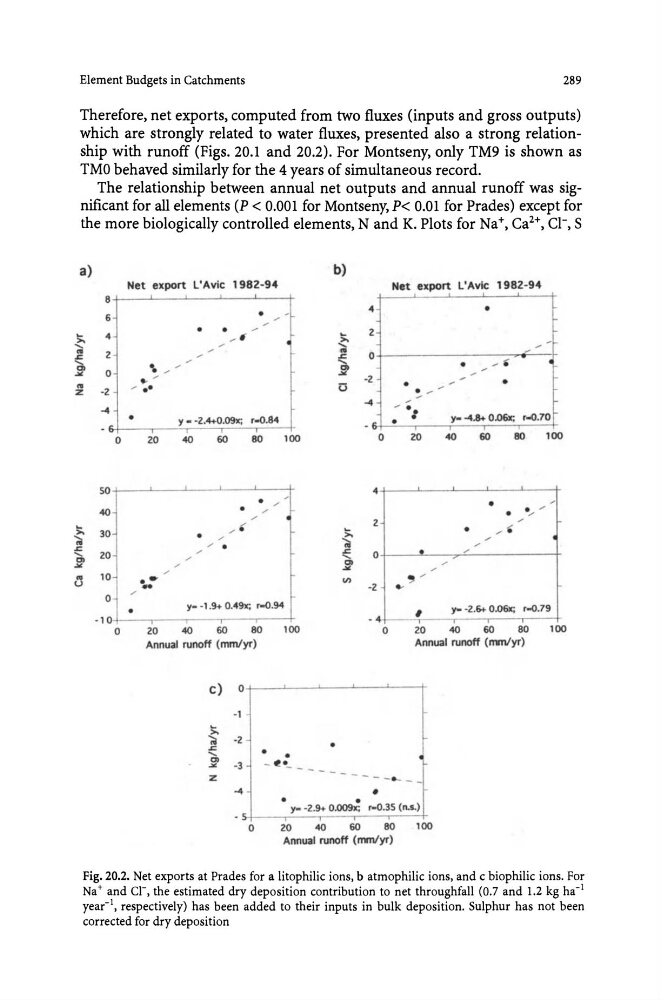
Therefore, net exports, computed from two fluxes (inputs and gross outputs)
which are strongly related to water fluxes, presented also a strong relationship with runoff (Figs. 20.1 and 20.2). For Montseny, only TM9 is shown as
TMO behaved similarly for the 4 years of simultaneous record.
The relationship between annual net outputs and annual runoff was significant for all elements (P < 0.001 for Montseny, P< om for Prades) except for
the more biologically controlled elements, Nand K. Plots for Na+, Ca2+, CI-, S
a)
b}
Net export L'Avic 1982-94
Net export L'Avic , 982-94
8
•
4
•
6
• •
z
!>.
4
-' ~
~
..... ... Z
... 0
s;
s;
•
.....
•
......
•
-' .
C>
~
.><
0
. -'
. . '
-Z
•
•
...
-' ..
u
-'
z
-Z
~ '
-4
, ..
-4
r-o.70
•
'I - -Z.4+0.09r. r-o.84
• •
'1- -4.8+ O.o6x;
0
20
40
60
80
100
0
ZO
40
60
80
100
so
4
•
•
40
• "
• ."
; '
,, (
•
2
,
...
...
•
- - '
>- 30
•
>.....
"
....
...
" •
s;
s;
.
..... Zo
.....
0
C>
~
...
'"
10
...
rJ)
~ /
U
-
-2
. .
0
"
•
'1- -1 .
9+ 0.49x; r-o.94
#
y- -2.S. 0.06x; r-o.79
- 10
0
20
40
60
80
100
0
ZO
40
60
80
100
Annual runoff (mmlyr)
Annual runoff (rrmlyr)
c) 0
-I
... >.... -2
s;
.....
C>
-3
...
z
• •
- e· _____ _
- - - - e-. __
•
•
-4
•
_ c
•
•
'1_ -2.9+ O.ooox; r-o.35 (n.s.)
0
ZO
40
60
80
100
Annual runoff (mm/yr)
Fig. 20.2. Net exports at Prades for a litophilic ions, b atmophilic ions, and c biophilic ions. For
Na+ and ct, the estimated dry deposition contribution to net throughfall (0.7 and 1.2 kg ha- 1
year-I, respectively) has been added to their inputs in bulk deposition. Sulphur has not been
corrected for dry deposition
289
Therefore, net exports, computed from two fluxes (inputs and gross outputs)
which are strongly related to water fluxes, presented also a strong relationship with runoff (Figs. 20.1 and 20.2). For Montseny, only TM9 is shown as
TMO behaved similarly for the 4 years of simultaneous record.
The relationship between annual net outputs and annual runoff was significant for all elements (P < 0.001 for Montseny, P< om for Prades) except for
the more biologically controlled elements, Nand K. Plots for Na+, Ca2+, CI-, S
a)
b}
Net export L'Avic 1982-94
Net export L'Avic , 982-94
8
•
4
•
6
• •
z
!>.
4
-' ~
~
..... ... Z
... 0
s;
s;
•
.....
•
......
•
-' .
C>
~
.><
0
. -'
. . '
-Z
•
•
...
-' ..
u
-'
z
-Z
~ '
-4
, ..
-4
r-o.70
•
'I - -Z.4+0.09r. r-o.84
• •
'1- -4.8+ O.o6x;
0
20
40
60
80
100
0
ZO
40
60
80
100
so
4
•
•
40
• "
• ."
; '
,, (
•
2
,
...
...
•
- - '
>- 30
•
>.....
"
....
...
" •
s;
s;
.
..... Zo
.....
0
C>
~
...
'"
10
...
rJ)
~ /
U
-
-2
. .
0
"
•
'1- -1 .
9+ 0.49x; r-o.94
#
y- -2.S. 0.06x; r-o.79
- 10
0
20
40
60
80
100
0
ZO
40
60
80
100
Annual runoff (mmlyr)
Annual runoff (rrmlyr)
c) 0
-I
... >.... -2
s;
.....
C>
-3
...
z
• •
- e· _____ _
- - - - e-. __
•
•
-4
•
_ c
•
•
'1_ -2.9+ O.ooox; r-o.35 (n.s.)
0
ZO
40
60
80
100
Annual runoff (mm/yr)
Fig. 20.2. Net exports at Prades for a litophilic ions, b atmophilic ions, and c biophilic ions. For
Na+ and ct, the estimated dry deposition contribution to net throughfall (0.7 and 1.2 kg ha- 1
year-I, respectively) has been added to their inputs in bulk deposition. Sulphur has not been
corrected for dry deposition