

Soil Water Chemistry
245
17.3.2.3 TEMPORAL VARIABILITY
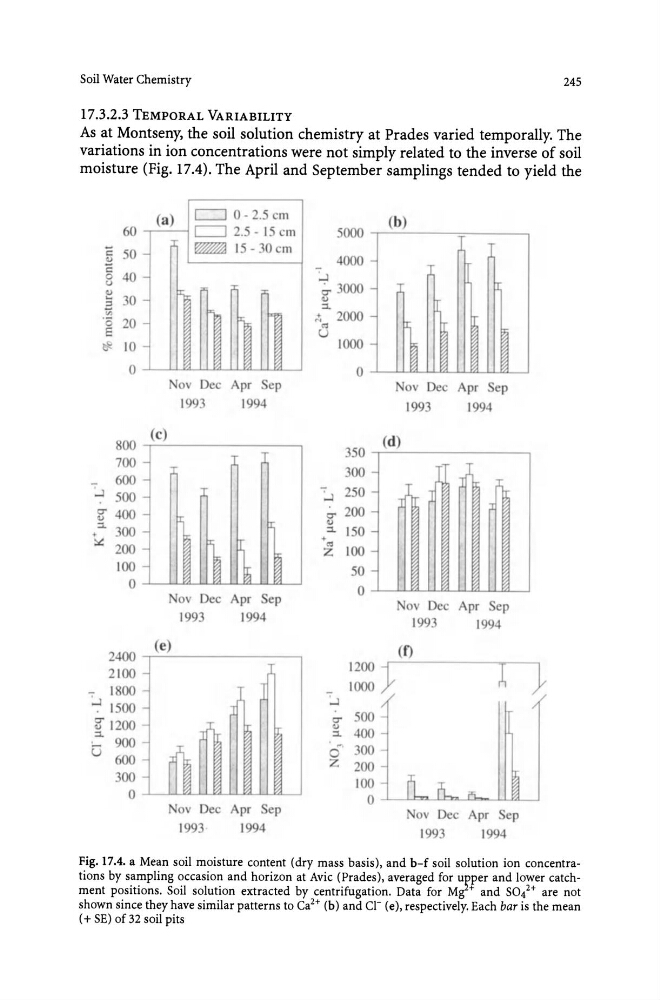
As at Montseny, the soil solution chemistry at Prades varied temporally. The
variations in ion concentrations were not simply related to the inverse of soil
moisture (Fig. 17.4). The April and September samplings tended to yield the
60
C 50
0
C 40
0
u
e:! 0
"
Vi
'0 20
E
10
0
800
7
..J 500
0'
400
v
:::l.. 300
+
:.:: 2
100
0
2400
2100
- I 00
~I
g'1200
~ 9
6
00
o
-
-
-
-
-
-
-
-
-
(a)
[:::::J 0 - 2.5 em
[:::::J 2.5 - 15 em
~ 15 - 30 m
ov Dec
pr Sep
1993
1994
(c)
~
1
~ ~
v Dec Apr Sep
1993
1994
(e)
~ I
ov D
Apr ep
1993
I 94
5
4
~
0..,
:::l..
+
'"
Z
1000
o
350
250
200
150
100
50
0
-
-
-
-
-
-
-
-
(b)
(d)
~
ov De
1993
v Dc
1993
(0
1200 }
1000
- ~
0S
..,
400
:::l..
6 300
z 200
100
0
~
pr ep
1994
pr ep
1994
~ }
Fig. 17.4. a Mean soil moisture content (dry mass basis), and b-f soil solution ion concentrations by sampling occasion and horizon at Avic (Prades), averaged for ul?per and lower catchment positions. Soil solution extracted by centrifugation. Data for Mgd and S042+ are not
shown since they have similar patterns to Ca 2 + (b) and Cl- (e), respectively. Each bar is the mean
(+ SE) of 32 soil pits
245
17.3.2.3 TEMPORAL VARIABILITY
As at Montseny, the soil solution chemistry at Prades varied temporally. The
variations in ion concentrations were not simply related to the inverse of soil
moisture (Fig. 17.4). The April and September samplings tended to yield the
60
C 50
0
C 40
0
u
e:! 0
"
Vi
'0 20
E
10
0
800
7
..J 500
0'
400
v
:::l.. 300
+
:.:: 2
100
0
2400
2100
- I 00
~I
g'1200
~ 9
6
00
o
-
-
-
-
-
-
-
-
-
(a)
[:::::J 0 - 2.5 em
[:::::J 2.5 - 15 em
~ 15 - 30 m
ov Dec
pr Sep
1993
1994
(c)
~
1
~ ~
v Dec Apr Sep
1993
1994
(e)
~ I
ov D
Apr ep
1993
I 94
5
4
~
0..,
:::l..
+
'"
Z
1000
o
350
250
200
150
100
50
0
-
-
-
-
-
-
-
-
(b)
(d)
~
ov De
1993
v Dc
1993
(0
1200 }
1000
- ~
0S
..,
400
:::l..
6 300
z 200
100
0
~
pr ep
1994
pr ep
1994
~ }
Fig. 17.4. a Mean soil moisture content (dry mass basis), and b-f soil solution ion concentrations by sampling occasion and horizon at Avic (Prades), averaged for ul?per and lower catchment positions. Soil solution extracted by centrifugation. Data for Mgd and S042+ are not
shown since they have similar patterns to Ca 2 + (b) and Cl- (e), respectively. Each bar is the mean
(+ SE) of 32 soil pits