

230
Isabel Serrasolses, Victoria Diego and David Bonilla
8
7
Montseny
6
~
5
z . '" 4
0
Z
0> 3
E
2
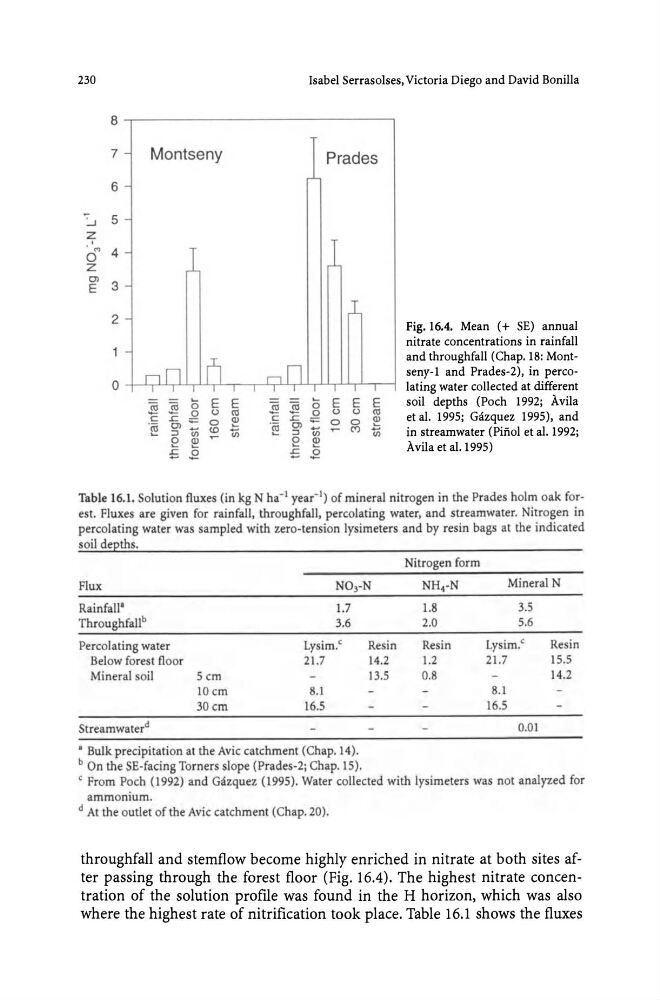
Fig. 16.4. Mean (+ SE) annual
nitrate concentrations in rainfall
and throughfall (Chap. 18: Montseny-l and Prades-2), in percolating water collected at different
m m () E E
m ~
~
E E E
soil depths (Poch 1992; Avila
0
C :c g
<.:>
0
<.:>
<.:>
0
E:
.c ;;:: 0 0
~
.~
0> ... (0
.~
0> ... (')
in streamwater (Pinol et aJ. 1992;
::J
en
1;;
::J
en
en
e E:
e E:
Avila et aI.1995)
-6 .E
-5 .E
Table 16.1. Solution fluxes (in kg N ha- I year- I) of mineral nitrogen in the Prades holm oak forest. Fluxes are given for rainfall, throughfall. percolating water, and streamwater. Nitrogen in
percolating water was sampled with zero-tension Iysimeters and by resin bags at the indicated
soil depths.
Flux
Rainfall'
Throughfal\b
Percolating water
Below forest floor
Mineral soil
5 cm
10 cm
30 cm
Streamwater d
1.7
3.6
Lysim.'
21.7
8.1
16.5
• Bulk precipitation at the Avic catchment (Chap. 14).
b On the SE-facing Torners slope (Prades-2j Chap. 15).
Resin
14.2
13.5
Nitrogen form
1.8
2.0
Resin
1.2
0.8
Mineral N
3.5
5.6
Lysim.'
21.7
8.1
16.5
0.01
Resin
15.5
14.2
, From Poch (1992) and Gazquez (1995). Water collected with Iysimeters was not analyzed for
ammonium.
d At the outlet of the Avic catchment (Chap. 20).
throughfall and stemflow become highly enriched in nitrate at both sites after passing through the forest floor (Fig. 16.4). The highest nitrate concentration of the solution proflie was found in the H horizon, which was also
where the highest rate of nitrification took place. Table 16.1 shows the fluxes
Isabel Serrasolses, Victoria Diego and David Bonilla
8
7
Montseny
6
~
5
z . '" 4
0
Z
0> 3
E
2
Fig. 16.4. Mean (+ SE) annual
nitrate concentrations in rainfall
and throughfall (Chap. 18: Montseny-l and Prades-2), in percolating water collected at different
m m () E E
m ~
~
E E E
soil depths (Poch 1992; Avila
0
C :c g
<.:>
0
<.:>
<.:>
0
E:
.c ;;:: 0 0
~
.~
0> ... (0
.~
0> ... (')
in streamwater (Pinol et aJ. 1992;
::J
en
1;;
::J
en
en
e E:
e E:
Avila et aI.1995)
-6 .E
-5 .E
Table 16.1. Solution fluxes (in kg N ha- I year- I) of mineral nitrogen in the Prades holm oak forest. Fluxes are given for rainfall, throughfall. percolating water, and streamwater. Nitrogen in
percolating water was sampled with zero-tension Iysimeters and by resin bags at the indicated
soil depths.
Flux
Rainfall'
Throughfal\b
Percolating water
Below forest floor
Mineral soil
5 cm
10 cm
30 cm
Streamwater d
1.7
3.6
Lysim.'
21.7
8.1
16.5
• Bulk precipitation at the Avic catchment (Chap. 14).
b On the SE-facing Torners slope (Prades-2j Chap. 15).
Resin
14.2
13.5
Nitrogen form
1.8
2.0
Resin
1.2
0.8
Mineral N
3.5
5.6
Lysim.'
21.7
8.1
16.5
0.01
Resin
15.5
14.2
, From Poch (1992) and Gazquez (1995). Water collected with Iysimeters was not analyzed for
ammonium.
d At the outlet of the Avic catchment (Chap. 20).
throughfall and stemflow become highly enriched in nitrate at both sites after passing through the forest floor (Fig. 16.4). The highest nitrate concentration of the solution proflie was found in the H horizon, which was also
where the highest rate of nitrification took place. Table 16.1 shows the fluxes