

218
Juan Bellot, Anna Avila and Anselm Rodrigo
African dust. African dust is transported to Europe typically at altitudes of
ca. 2000-5000 m above the Earth's surface. Hence, its removal is generally
considered to occur in wet rather than in dry form, and more data are available for wet than for dry deposition fluxes. We have checked our data from
individual red-rain events (or sampling periods) to test whether red-rains
produce increased net throughfall fluxes and T/BD ratios of Ca 2 + and Mg2+
through dry deposition of African dust onto the forest canopy. Unfortunately,
only 5 events were useful for this purpose (2 at Prades and 3 at Montseny).
Only one of these showed a markedly enhanced removal of Ca 2 + and Mg2+
from the canopy, while another showed a moderate increase. This is a weak
base to test the hypothesis. Dry deposition of African dust onto Mediterranean forests clearly merits further research.
15.5 Net Inputs and Sources of Nutrients
in Throughfal1 and Stemflow
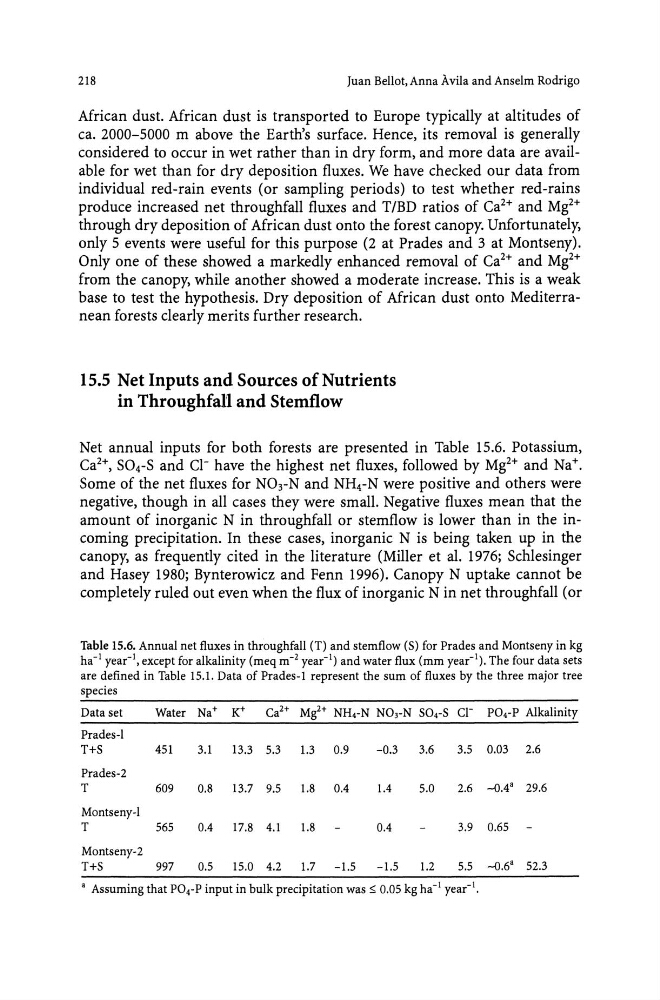
Net annual inputs for both forests are presented in Table 15.6. Potassium,
Ca 2 +, S04-S and CI- have the highest net fluxes, followed by Mg2+ and Na+.
Some of the net fluxes for N03-N and NH4-N were positive and others were
negative, though in all cases they were small. Negative fluxes mean that the
amount of inorganic N in throughfall or stemflow is lower than in the incoming precipitation. In these cases, inorganic N is being taken up in the
canopy, as frequently cited in the literature (Miller et al. 1976; Schlesinger
and Hasey 1980; Bynterowicz and Fenn 1996). Canopy N uptake cannot be
completely ruled out even when the flux of inorganic N in net throughfall (or
Table 15.6. Annual net fluxes in throughfall (T) and stemflow (S) for Prades and Montseny in kg
ha- I year-I, except for alkalinity (meq m- z year-I) and water flux (mm year-I). The four data sets
are defined in Table 15.1. Data of Prades-1 represent the sum of fluxes by the three major tree
species
Data set
Water Na+ K+
Ca z + Mi+ NH4-N N03-N S04-S cr P04-P Alkalinity
Prades-l
T+S
451
3.1
13.3 5.3
1.3
0.9
-0.3
3.6
3.5 0.03 2.6
Prades-2
T
609
0.8
13.7 9.5
1.8
0.4
1.4
5.0
2.6 -0.4" 29.6
Montseny-l
T
565
0.4
17.8 4.1
1.8
0.4
3.9 0.65
Montseny-2
T+S
997
0.5
15.0 4.2
1.7
-1.5
-1.5
1.2
5.5 -0.6" 52.3
" Assuming that P04-P input in bulk precipitation was :0; 0.05 kg ha- I year-I.
Juan Bellot, Anna Avila and Anselm Rodrigo
African dust. African dust is transported to Europe typically at altitudes of
ca. 2000-5000 m above the Earth's surface. Hence, its removal is generally
considered to occur in wet rather than in dry form, and more data are available for wet than for dry deposition fluxes. We have checked our data from
individual red-rain events (or sampling periods) to test whether red-rains
produce increased net throughfall fluxes and T/BD ratios of Ca 2 + and Mg2+
through dry deposition of African dust onto the forest canopy. Unfortunately,
only 5 events were useful for this purpose (2 at Prades and 3 at Montseny).
Only one of these showed a markedly enhanced removal of Ca 2 + and Mg2+
from the canopy, while another showed a moderate increase. This is a weak
base to test the hypothesis. Dry deposition of African dust onto Mediterranean forests clearly merits further research.
15.5 Net Inputs and Sources of Nutrients
in Throughfal1 and Stemflow
Net annual inputs for both forests are presented in Table 15.6. Potassium,
Ca 2 +, S04-S and CI- have the highest net fluxes, followed by Mg2+ and Na+.
Some of the net fluxes for N03-N and NH4-N were positive and others were
negative, though in all cases they were small. Negative fluxes mean that the
amount of inorganic N in throughfall or stemflow is lower than in the incoming precipitation. In these cases, inorganic N is being taken up in the
canopy, as frequently cited in the literature (Miller et al. 1976; Schlesinger
and Hasey 1980; Bynterowicz and Fenn 1996). Canopy N uptake cannot be
completely ruled out even when the flux of inorganic N in net throughfall (or
Table 15.6. Annual net fluxes in throughfall (T) and stemflow (S) for Prades and Montseny in kg
ha- I year-I, except for alkalinity (meq m- z year-I) and water flux (mm year-I). The four data sets
are defined in Table 15.1. Data of Prades-1 represent the sum of fluxes by the three major tree
species
Data set
Water Na+ K+
Ca z + Mi+ NH4-N N03-N S04-S cr P04-P Alkalinity
Prades-l
T+S
451
3.1
13.3 5.3
1.3
0.9
-0.3
3.6
3.5 0.03 2.6
Prades-2
T
609
0.8
13.7 9.5
1.8
0.4
1.4
5.0
2.6 -0.4" 29.6
Montseny-l
T
565
0.4
17.8 4.1
1.8
0.4
3.9 0.65
Montseny-2
T+S
997
0.5
15.0 4.2
1.7
-1.5
-1.5
1.2
5.5 -0.6" 52.3
" Assuming that P04-P input in bulk precipitation was :0; 0.05 kg ha- I year-I.