

204
A. Escam!,A. Carratalli,A. Avila, J. Bellot, J. Pinol and M. Millan
::J
CT 100
Ql
2:
c 80
0
.~
C 60
Q)
u
c
0
u
40
(ij
:::J
C
20
c
«l
C
«l
Ql
0
~
C\I
C')
~
r= O.72
"
<0
,....
Ol
q> Ol Ol
M ~ J, cb ..:.. cb 0, 6 ,.... N M
eX)
eX)
eX)
eX)
eX)
Ol
Ol
Ol
0>
Year
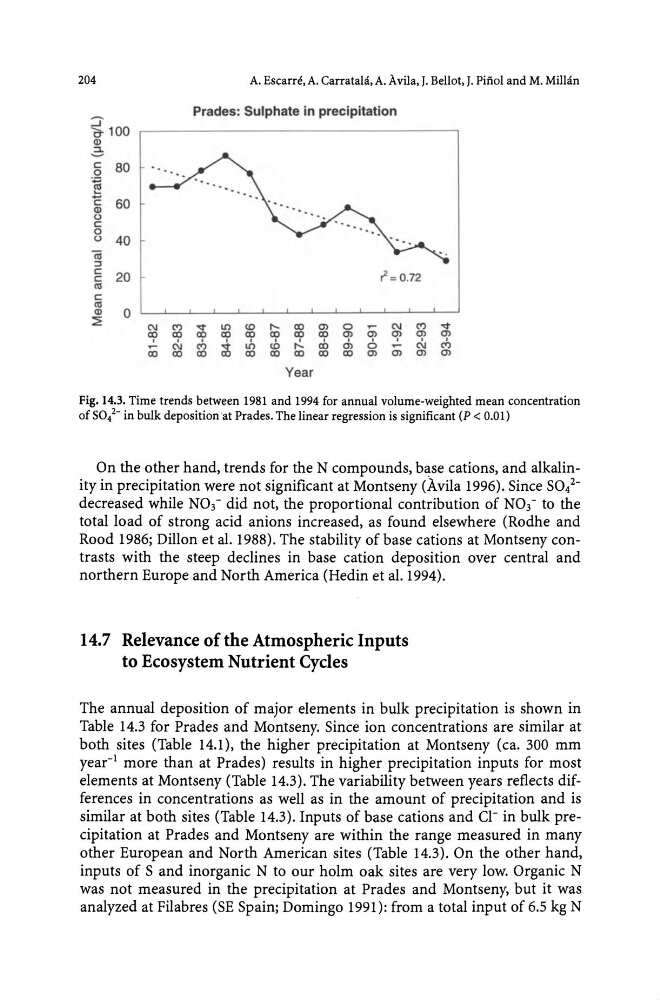
Fig. 14.3. Time trends between 1981 and 1994 for annual volume-weighted mean concentration
of soi- in bulk deposition ' at Prades. The linear regression is significant (P < 0.01)
On the other hand, trends for the N compounds, base cations, and alkalinity in precipitation were not significant at Montseny (Avila 1996). Since SO/decreased while N03 - did not, the proportional contribution of N03 - to the
total load of strong acid anions increased, as found elsewhere (Rodhe and
Rood 1986; Dillon et al. 1988). The stability of base cations at Montseny contrasts with the steep declines in base cation deposition over central and
northern Europe and North America (Hedin et al. 1994).
14.7 Relevance of the Atmospheric Inputs
to Ecosystem Nutrient Cycles
The annual deposition of major elements in bulk precipitation is shown in
Table 14.3 for Prades and Montseny. Since ion concentrations are similar at
both sites (Table 14.1), the higher precipitation at Montseny (ca. 300 mm
year- 1 more than at Prades) results in higher precipitation inputs for most
elements at Montseny (Table 14.3). The variability between years reflects differences in concentrations as well as in the amount of precipitation and is
similar at both sites (Table 14.3). Inputs of base cations and CI- in bulk precipitation at Prades and Montseny are within the range measured in many
other European and North American sites (Table 14.3). On the other hand,
inputs of S and inorganic N to our holm oak sites are very low. Organic N
was not measured in the precipitation at Prades and Montseny, but it was
analyzed at Filabres (SE Spain; Domingo 1991): from a total input of 6.5 kg N
A. Escam!,A. Carratalli,A. Avila, J. Bellot, J. Pinol and M. Millan
::J
CT 100
Ql
2:
c 80
0
.~
C 60
Q)
u
c
0
u
40
(ij
:::J
C
20
c
«l
C
«l
Ql
0
~
C\I
C')
~
r= O.72
"
<0
,....
Ol
q> Ol Ol
M ~ J, cb ..:.. cb 0, 6 ,.... N M
eX)
eX)
eX)
eX)
eX)
Ol
Ol
Ol
0>
Year
Fig. 14.3. Time trends between 1981 and 1994 for annual volume-weighted mean concentration
of soi- in bulk deposition ' at Prades. The linear regression is significant (P < 0.01)
On the other hand, trends for the N compounds, base cations, and alkalinity in precipitation were not significant at Montseny (Avila 1996). Since SO/decreased while N03 - did not, the proportional contribution of N03 - to the
total load of strong acid anions increased, as found elsewhere (Rodhe and
Rood 1986; Dillon et al. 1988). The stability of base cations at Montseny contrasts with the steep declines in base cation deposition over central and
northern Europe and North America (Hedin et al. 1994).
14.7 Relevance of the Atmospheric Inputs
to Ecosystem Nutrient Cycles
The annual deposition of major elements in bulk precipitation is shown in
Table 14.3 for Prades and Montseny. Since ion concentrations are similar at
both sites (Table 14.1), the higher precipitation at Montseny (ca. 300 mm
year- 1 more than at Prades) results in higher precipitation inputs for most
elements at Montseny (Table 14.3). The variability between years reflects differences in concentrations as well as in the amount of precipitation and is
similar at both sites (Table 14.3). Inputs of base cations and CI- in bulk precipitation at Prades and Montseny are within the range measured in many
other European and North American sites (Table 14.3). On the other hand,
inputs of S and inorganic N to our holm oak sites are very low. Organic N
was not measured in the precipitation at Prades and Montseny, but it was
analyzed at Filabres (SE Spain; Domingo 1991): from a total input of 6.5 kg N