

196
A. Escarre,A. Carratala,A. Avila, J. BelIot, J. Pinol and M. MilIan
graphical view using a precipitation network in eastern Spain, and a long
temporal view analyzing decadal trends in precipitation chemistry at our
holm oak sites. Using back-trajectory analysis and mesoscale meteorology,
we next attempt to outline the extent of the airshed ecosystem and to identify
the mesoscale determinants of pollutant transport in this area. We finish
with an assessment of the relevance of precipitation inputs for the nutrient
cycles in holm oak ecosystems.
14.2 Bulk Precipitation Chemistry at Prades and Montseny
A continuous event/weekly sampling schedule of bulk precipitation chemistry started at Prades and Montseny in 1981 and 1983, respectively, as part of
catchment monitoring programmes. At Prades, bulk precipitation was sampled in I' Avic catchment until December 1983 and at the outlet of la Teula
catchment thereafter (Chap. 2). At Montseny, it was sampled at the outlet of
the TM9 catchment (Chap. 2).
Volume-weighted mean (VWM) concentrations for 13-year (Prades) and
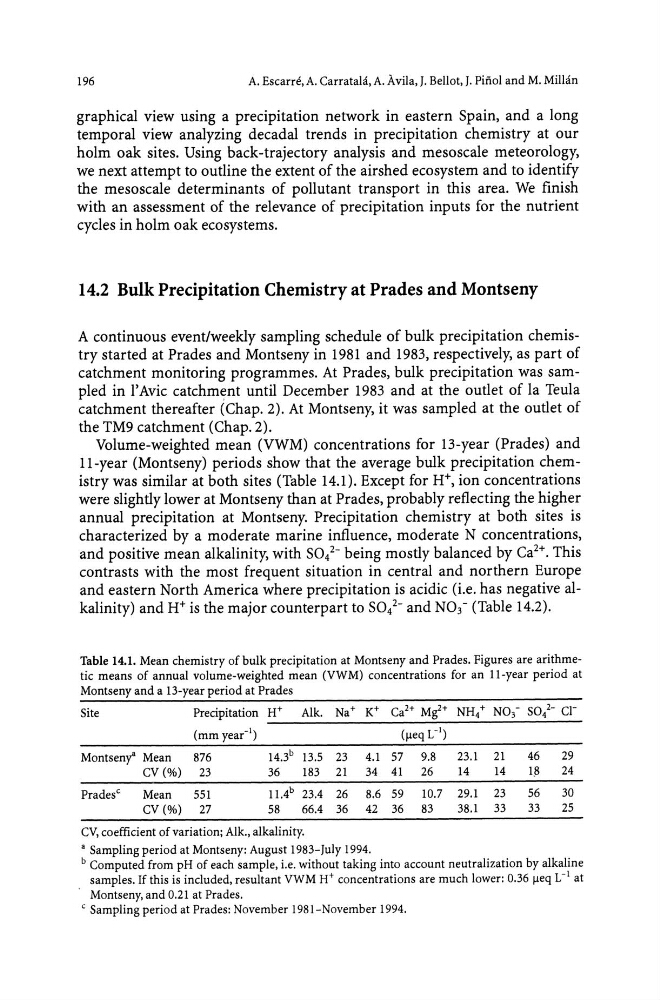
II-year (Montseny) periods show that the average bulk precipitation chemistry was similar at both sites (Table 14.1). Except for H+, ion concentrations
were slightly lower at Montseny than at Prades, probably reflecting the higher
annual precipitation at Montseny. Precipitation chemistry at both sites is
characterized by a moderate marine influence, moderate N concentrations,
and positive mean alkalinity, with sol- being mostly balanced by Ca 2 +. This
contrasts with the most frequent situation in central and northern Europe
and eastern North America where precipitation is acidic (i.e. has negative alkalinity) and H+ is the major counterpart to sol- and N03 - (Table 14.2).
Table 14.1. Mean chemistry of bulk precipitation at Montseny and Prades. Figures are arithmetic means of annual volume-weighted mean (VWM) concentrations for an II-year period at
Montseny and a 13-year period at Prades
Site
Montseny" Mean
876
14.3 b 13.5 23 4.1 57 9.8
23.1 21
46
29
CV (%) 23
36
183
Prades c
Mean
551
11.4 b 23.4
CV(%) 27
58
66.4
CV, coefficient of variation; Alk., alkalinity.
21
26
36
34 41
26
14
8.6 59
42 36
10.7 29.1
83
38.1
14
18
24
23
33
56
33
30
25
• Sampling period at Montseny: August 1983-July 1994.
b Computed from pH of each sample, i.e. without taking into account neutralization by alkaline
samples. If this is included, resultant VWM H+ concentrations are much lower: 0.36 fleq L- 1 at
Montseny, and 0.21 at Prades.
C Sampling period at Prades: November 1981-November 1994.
A. Escarre,A. Carratala,A. Avila, J. BelIot, J. Pinol and M. MilIan
graphical view using a precipitation network in eastern Spain, and a long
temporal view analyzing decadal trends in precipitation chemistry at our
holm oak sites. Using back-trajectory analysis and mesoscale meteorology,
we next attempt to outline the extent of the airshed ecosystem and to identify
the mesoscale determinants of pollutant transport in this area. We finish
with an assessment of the relevance of precipitation inputs for the nutrient
cycles in holm oak ecosystems.
14.2 Bulk Precipitation Chemistry at Prades and Montseny
A continuous event/weekly sampling schedule of bulk precipitation chemistry started at Prades and Montseny in 1981 and 1983, respectively, as part of
catchment monitoring programmes. At Prades, bulk precipitation was sampled in I' Avic catchment until December 1983 and at the outlet of la Teula
catchment thereafter (Chap. 2). At Montseny, it was sampled at the outlet of
the TM9 catchment (Chap. 2).
Volume-weighted mean (VWM) concentrations for 13-year (Prades) and
II-year (Montseny) periods show that the average bulk precipitation chemistry was similar at both sites (Table 14.1). Except for H+, ion concentrations
were slightly lower at Montseny than at Prades, probably reflecting the higher
annual precipitation at Montseny. Precipitation chemistry at both sites is
characterized by a moderate marine influence, moderate N concentrations,
and positive mean alkalinity, with sol- being mostly balanced by Ca 2 +. This
contrasts with the most frequent situation in central and northern Europe
and eastern North America where precipitation is acidic (i.e. has negative alkalinity) and H+ is the major counterpart to sol- and N03 - (Table 14.2).
Table 14.1. Mean chemistry of bulk precipitation at Montseny and Prades. Figures are arithmetic means of annual volume-weighted mean (VWM) concentrations for an II-year period at
Montseny and a 13-year period at Prades
Site
Montseny" Mean
876
14.3 b 13.5 23 4.1 57 9.8
23.1 21
46
29
CV (%) 23
36
183
Prades c
Mean
551
11.4 b 23.4
CV(%) 27
58
66.4
CV, coefficient of variation; Alk., alkalinity.
21
26
36
34 41
26
14
8.6 59
42 36
10.7 29.1
83
38.1
14
18
24
23
33
56
33
30
25
• Sampling period at Montseny: August 1983-July 1994.
b Computed from pH of each sample, i.e. without taking into account neutralization by alkaline
samples. If this is included, resultant VWM H+ concentrations are much lower: 0.36 fleq L- 1 at
Montseny, and 0.21 at Prades.
C Sampling period at Prades: November 1981-November 1994.