

GOTILWA: An Integrated Model of Water Dynamics and Forest Growth
:c
c 40
0
E
....
' E 30
~
0
.9 20
...J
...J
q:
10
u..
0::
w
~
...J
83 84 85
MODEL VALIDATION
MONTHLY LlTIERFALL
40
0
30
w
~
a
::::> 20
~
I/)
10
86 87 88 89
a
a
10
20
30
40
OBSERVED
173
TIME (months, 1982 - 1989)
- - OBSERVED
Sim = 0.906· Obs + 3.148 ~ = 0.658
0
w
~ ::::>
~
u;
SIMULAnON OF CONTROL PLOT 1
SIMULATION OF CONTROL PLOT 2
TREE RING WIDTH (mm), 1992 - 94
6
4
0
CONTROL PLOT
• MINIMUM THINNING
2
a MAXIMUM THINNING
4
6
OBSERVED
~ = 0.917
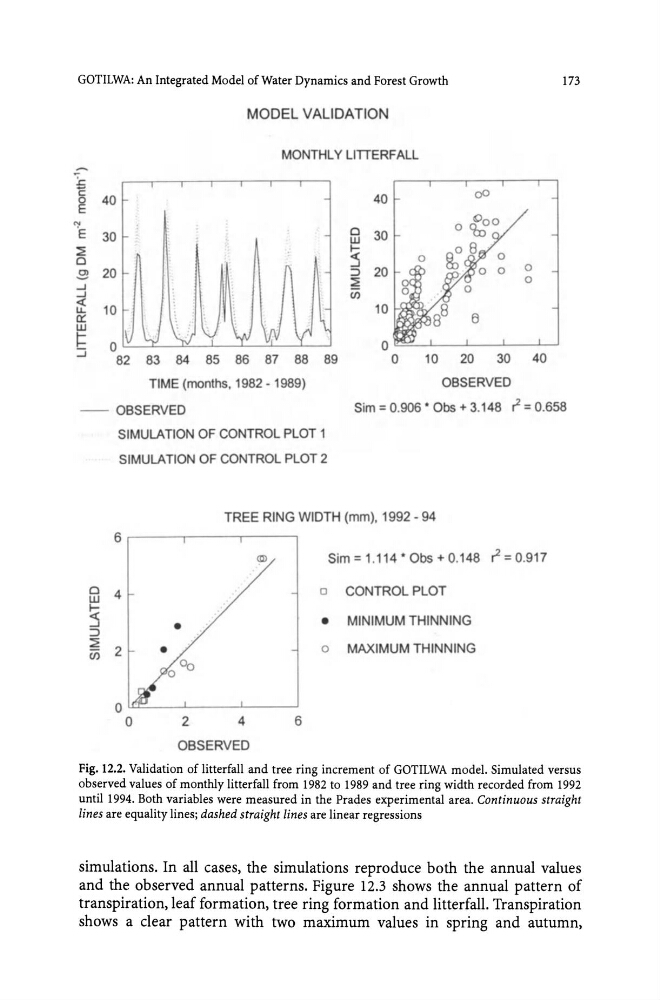
Fig. 12.2. Validation of litterfall and tree ring increment of GOTILWA model. Simulated versus
observed values of monthly litterfall from 1982 to 1989 and tree ring width recorded from 1992
until 1994. Both variables were measured in the Prades experimental area. Continuous straight
lines are equality lines; dashed straight lines are linear regressions
simulations. In all cases, the simulations reproduce both the annual values
and the observed annual patterns. Figure 12.3 shows the annual pattern of
transpiration, leaf formation, tree ring formation and litterfall. Transpiration
shows a clear pattern with two maximum values in spring and autumn,
:c
c 40
0
E
....
' E 30
~
0
.9 20
...J
...J
q:
10
u..
0::
w
~
...J
83 84 85
MODEL VALIDATION
MONTHLY LlTIERFALL
40
0
30
w
~
a
::::> 20
~
I/)
10
86 87 88 89
a
a
10
20
30
40
OBSERVED
173
TIME (months, 1982 - 1989)
- - OBSERVED
Sim = 0.906· Obs + 3.148 ~ = 0.658
0
w
~ ::::>
~
u;
SIMULAnON OF CONTROL PLOT 1
SIMULATION OF CONTROL PLOT 2
TREE RING WIDTH (mm), 1992 - 94
6
4
0
CONTROL PLOT
• MINIMUM THINNING
2
a MAXIMUM THINNING
4
6
OBSERVED
~ = 0.917
Fig. 12.2. Validation of litterfall and tree ring increment of GOTILWA model. Simulated versus
observed values of monthly litterfall from 1982 to 1989 and tree ring width recorded from 1992
until 1994. Both variables were measured in the Prades experimental area. Continuous straight
lines are equality lines; dashed straight lines are linear regressions
simulations. In all cases, the simulations reproduce both the annual values
and the observed annual patterns. Figure 12.3 shows the annual pattern of
transpiration, leaf formation, tree ring formation and litterfall. Transpiration
shows a clear pattern with two maximum values in spring and autumn,