

130
Santiago Sabate, Anna Sala and Carlos A. Gracia
A
Ridge site
• Valley site
DATE ...
CANOPY DEPTH
DATE '"
SITE ••
C.D. , ••
TOP
C.D ....
350
N +
I
I
I
I
I
35
30
300
ry
25
250
E
20
200 -
0
15
150 -
I
N
1.0
10
I
100
0
E
- I I
I
I
1
I
u
35
C)
350 rI
I
I
I
I
I
I
:::J..
~ ~
30
-
300 r25
(/)
250 rE
'w 200 r1.0
20
ro
c:i
15
..0.
150 rI
ro
..10
Q)
100 r- I
I
I
"ro
35
..... 350
I
I
ro
30
Q)
300
ro 250
r-tr4
E
~
25
c
200
20
0
N
15
c
150
Q)
10
C)
100
I
I
0
"35
~
350 rI
Z
30
300 rE
25
250 rN
20
200 f~
I
'U
15
150 rc
:::J
10
100 fa
I
I
I.
....
OJ
sm88 au88 sp89 sm89 au89
sm88 au88 sp89 sm89 au89
Sampling date
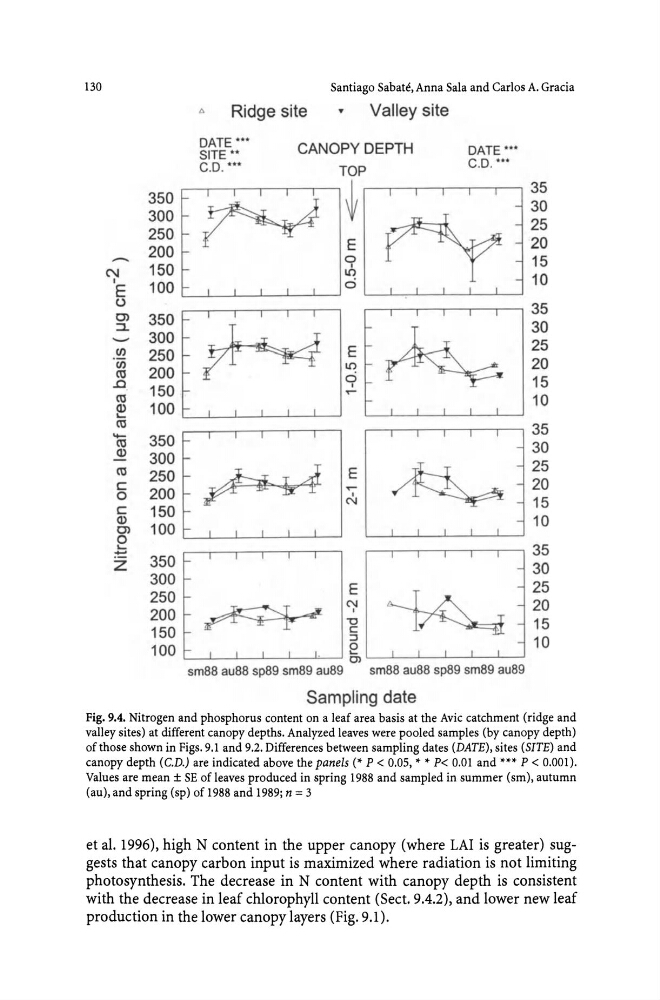
Fig. 9.4. Nitrogen and phosphorus content on a leaf area basis at the Avic catchment (ridge and
valley sites) at different canopy depths. Analyzed leaves were pooled samples (by canopy depth)
of those shown in Figs. 9.1 and 9.2. Differences between sampling dates (DATE), sites (SITE) and
canopy depth (C.D.) are indicated above the panels (* P < 0.05, >I- >I- P< 0,01 and >1->1->1- P < 0.001).
Values are mean ± SE of leaves produced in spring 1988 and sampled in summer (sm), autumn
(au), and spring (sp) of 1988 and 1989; n = 3
et al. 1996), high N content in the upper canopy (where LAl is greater) suggests that canopy carbon input is maximized where radiation is not limiting
photosynthesis. The decrease in N content with canopy depth is consistent
with the decrease in leaf chlorophyll content (Sect. 9.4.2), and lower new leaf
production in the lower canopy layers (Fig. 9.1).
Santiago Sabate, Anna Sala and Carlos A. Gracia
A
Ridge site
• Valley site
DATE ...
CANOPY DEPTH
DATE '"
SITE ••
C.D. , ••
TOP
C.D ....
350
N +
I
I
I
I
I
35
30
300
ry
25
250
E
20
200 -
0
15
150 -
I
N
1.0
10
I
100
0
E
- I I
I
I
1
I
u
35
C)
350 rI
I
I
I
I
I
I
:::J..
~ ~
30
-
300 r25
(/)
250 rE
'w 200 r1.0
20
ro
c:i
15
..0.
150 rI
ro
..10
Q)
100 r- I
I
I
"ro
35
..... 350
I
I
ro
30
Q)
300
ro 250
r-tr4
E
~
25
c
200
20
0
N
15
c
150
Q)
10
C)
100
I
I
0
"35
~
350 rI
Z
30
300 rE
25
250 rN
20
200 f~
I
'U
15
150 rc
:::J
10
100 fa
I
I
I.
....
OJ
sm88 au88 sp89 sm89 au89
sm88 au88 sp89 sm89 au89
Sampling date
Fig. 9.4. Nitrogen and phosphorus content on a leaf area basis at the Avic catchment (ridge and
valley sites) at different canopy depths. Analyzed leaves were pooled samples (by canopy depth)
of those shown in Figs. 9.1 and 9.2. Differences between sampling dates (DATE), sites (SITE) and
canopy depth (C.D.) are indicated above the panels (* P < 0.05, >I- >I- P< 0,01 and >1->1->1- P < 0.001).
Values are mean ± SE of leaves produced in spring 1988 and sampled in summer (sm), autumn
(au), and spring (sp) of 1988 and 1989; n = 3
et al. 1996), high N content in the upper canopy (where LAl is greater) suggests that canopy carbon input is maximized where radiation is not limiting
photosynthesis. The decrease in N content with canopy depth is consistent
with the decrease in leaf chlorophyll content (Sect. 9.4.2), and lower new leaf
production in the lower canopy layers (Fig. 9.1).