

126
Santiago Sabate, Anna Sala and Carlos A. Gracia
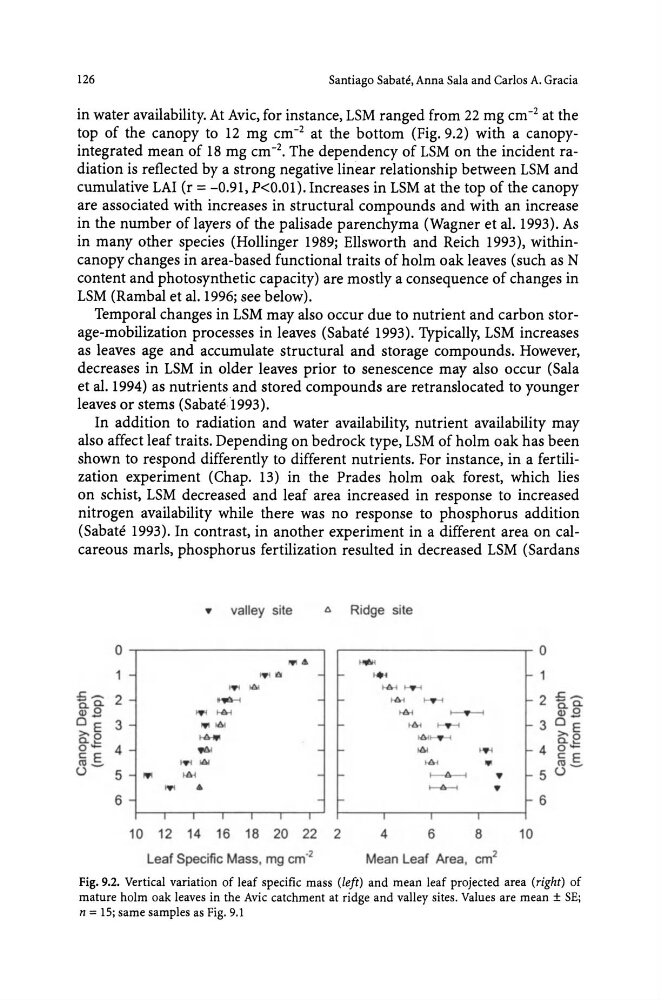
in water availability. At Avic, for instance, LSM ranged from 22 mg cm- 2 at the
top of the canopy to 12 mg cm- 2 at the bottom (Fig. 9.2) with a canopyintegrated mean of 18 mg cm- 2 • The dependency of LSM on the incident radiation is reflected by a strong negative linear relationship between LSM and
cumulative LAI (r = -0.91, P
in the number of layers of the palisade parenchyma (Wagner et a1. 1993). As
in many other species (Hollinger 1989; Ellsworth and Reich 1993), withincanopy changes in area-based functional traits of holm oak leaves (such as N
content and photosynthetic capacity) are mostly a consequence of changes in
LSM (Rambal et al. 1996; see below).
Temporal changes in LSM may also occur due to nutrient and carbon storage-mobilization processes in leaves (Sabate 1993). Typically, LSM increases
as leaves age and accumulate structural and storage compounds. However,
decreases in LSM in older leaves prior to senescence may also occur (Sala
et al. 1994) as nutrients and stored compounds are retranslocated to younger
leaves or stems (Sabate,t993).
In addition to radiation and water availability, nutrient availability may
also affect leaf traits. Depending on bedrock type, LSM of holm oak has been
shown to respond differently to different nutrients. For instance, in a fertilization experiment (Chap. 13) in the Prades holm oak forest, which lies
on schist, LSM decreased and leaf area increased in response to increased
nitrogen availability while there was no response to phosphorus addition
(Sabate 1993). In contrast, in another experiment in a different area on calcareous marls, phosphorus fertilization resulted in decreased LSM (Sardans
•
valley site
Co
Ridge site
0
0
.....
1
I!li
2
.I::...- 0 .
0. 0
Gl_
3 DE
>'0
~
4
g..c
C:E
III
ro~
•
5 u
~ 161
5-- 2
0.0.
OJ£!
~
>-6-l
DE 3
", !6I
>'0
~
c. ...
0 - 4
~
c: E
~ 161
J~ 5
'"
~
..
•
6
6
10 12 14 16 18 20 22 2
4
6
8
10
Leaf Specific Mass, mg cm· 2
Mean Leaf Area, cm 2
Fig. 9.2. Vertical variation of leaf specific mass (left) and mean leaf projected area (right) of
mature holm oak leaves in the Avic catchment at ridge and valley sites. Values are mean ± SE;
n = 15; same samples as Fig. 9.1
Santiago Sabate, Anna Sala and Carlos A. Gracia
in water availability. At Avic, for instance, LSM ranged from 22 mg cm- 2 at the
top of the canopy to 12 mg cm- 2 at the bottom (Fig. 9.2) with a canopyintegrated mean of 18 mg cm- 2 • The dependency of LSM on the incident radiation is reflected by a strong negative linear relationship between LSM and
cumulative LAI (r = -0.91, P
in the number of layers of the palisade parenchyma (Wagner et a1. 1993). As
in many other species (Hollinger 1989; Ellsworth and Reich 1993), withincanopy changes in area-based functional traits of holm oak leaves (such as N
content and photosynthetic capacity) are mostly a consequence of changes in
LSM (Rambal et al. 1996; see below).
Temporal changes in LSM may also occur due to nutrient and carbon storage-mobilization processes in leaves (Sabate 1993). Typically, LSM increases
as leaves age and accumulate structural and storage compounds. However,
decreases in LSM in older leaves prior to senescence may also occur (Sala
et al. 1994) as nutrients and stored compounds are retranslocated to younger
leaves or stems (Sabate,t993).
In addition to radiation and water availability, nutrient availability may
also affect leaf traits. Depending on bedrock type, LSM of holm oak has been
shown to respond differently to different nutrients. For instance, in a fertilization experiment (Chap. 13) in the Prades holm oak forest, which lies
on schist, LSM decreased and leaf area increased in response to increased
nitrogen availability while there was no response to phosphorus addition
(Sabate 1993). In contrast, in another experiment in a different area on calcareous marls, phosphorus fertilization resulted in decreased LSM (Sardans
•
valley site
Co
Ridge site
0
0
.....
1
I!li
2
.I::...- 0 .
0. 0
Gl_
3 DE
>'0
~
4
g..c
C:E
III
ro~
•
5 u
~ 161
5-- 2
0.0.
OJ£!
~
>-6-l
DE 3
", !6I
>'0
~
c. ...
0 - 4
~
c: E
~ 161
J~ 5
'"
~
..
•
6
6
10 12 14 16 18 20 22 2
4
6
8
10
Leaf Specific Mass, mg cm· 2
Mean Leaf Area, cm 2
Fig. 9.2. Vertical variation of leaf specific mass (left) and mean leaf projected area (right) of
mature holm oak leaves in the Avic catchment at ridge and valley sites. Values are mean ± SE;
n = 15; same samples as Fig. 9.1