

A Model of Stand Dynamics for Holm Oak-Aleppo Pine Forests
109
f
0.8
0.7
0.6
0 .6
0.4
0,3
02
0.1
f
0,4
0.3
02
0.1
Droughllength: 8 mo.
0.0
0.4
0.8
12
1.6
Oak proportion
Drought length: 5 mo.
00
0.4
0.8
12
1.6
Oak proportion
Drought length: 6 mo.
f ,--____ -,
05
0.4
0.3
0.2
0.1
0.0
0 ,4
0 .8
1 .2 1,6
Oak proportion
Drought length: 4 mo.
f ..--_ _ _ _ -,
0.6
0.5
0.4
0,3
0.2
01
00
04
0,8
12
1.6
Oak proportion
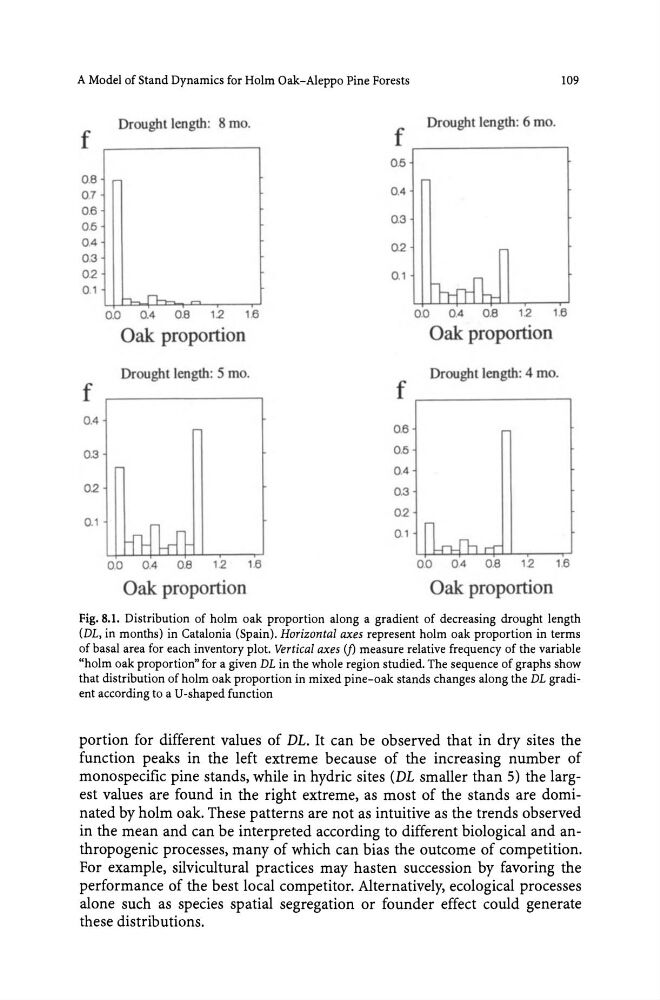
Fig. 8.1. Distribution of holm oak proportion along a gradient of decreasing drought length
(DL, in months) in Catalonia (Spain). Horizontal axes represent holm oak proportion in terms
of basal area for each inventory plot. Vertical axes (j) measure relative frequency of the variable
"holm oak proportion" for a given DL in the whole region studied. The sequence of graphs show
that distribution of holm oak proportion in mixed pine-oak stands changes along the DL gradient according to a U-shaped function
portion for different values of DL. It can be observed that in dry sites the
function peaks in the left extreme because of the increasing number of
mono specific pine stands, while in hydric sites (DL smaller than 5) the largest values are found in the right extreme, as most of the stands are dominated by holm oak. These patterns are not as intuitive as the trends observed
in the mean and can be interpreted according to different biological and anthropogenic processes, many of which can bias the outcome of competition.
For example, silvicultural practices may hasten succession by favoring the
performance of the best local competitor. Alternatively, ecological processes
alone such as species spatial segregation or founder effect could generate
these distributions.
109
f
0.8
0.7
0.6
0 .6
0.4
0,3
02
0.1
f
0,4
0.3
02
0.1
Droughllength: 8 mo.
0.0
0.4
0.8
12
1.6
Oak proportion
Drought length: 5 mo.
00
0.4
0.8
12
1.6
Oak proportion
Drought length: 6 mo.
f ,--____ -,
05
0.4
0.3
0.2
0.1
0.0
0 ,4
0 .8
1 .2 1,6
Oak proportion
Drought length: 4 mo.
f ..--_ _ _ _ -,
0.6
0.5
0.4
0,3
0.2
01
00
04
0,8
12
1.6
Oak proportion
Fig. 8.1. Distribution of holm oak proportion along a gradient of decreasing drought length
(DL, in months) in Catalonia (Spain). Horizontal axes represent holm oak proportion in terms
of basal area for each inventory plot. Vertical axes (j) measure relative frequency of the variable
"holm oak proportion" for a given DL in the whole region studied. The sequence of graphs show
that distribution of holm oak proportion in mixed pine-oak stands changes along the DL gradient according to a U-shaped function
portion for different values of DL. It can be observed that in dry sites the
function peaks in the left extreme because of the increasing number of
mono specific pine stands, while in hydric sites (DL smaller than 5) the largest values are found in the right extreme, as most of the stands are dominated by holm oak. These patterns are not as intuitive as the trends observed
in the mean and can be interpreted according to different biological and anthropogenic processes, many of which can bias the outcome of competition.
For example, silvicultural practices may hasten succession by favoring the
performance of the best local competitor. Alternatively, ecological processes
alone such as species spatial segregation or founder effect could generate
these distributions.