

327
the post fl ood problems turn the society into
social disorder. Economic distresses due to fl ood
compel male members of the family to migrate to
distant places in search of employment. It is one
of the important fl ood-related social problems in
the rural areas. As per the present study, in the
village, Golibandha alone, most of the school- goer
children were dropped out and engaged as daily
workers to quench their families. Flood damaged
almost all agro-based survival potentialities and
people who have no other substitute for survival
except agriculture have to force to indulge antisocial malpractices like theft, robbery and so on.
Socioeconomic Impacts
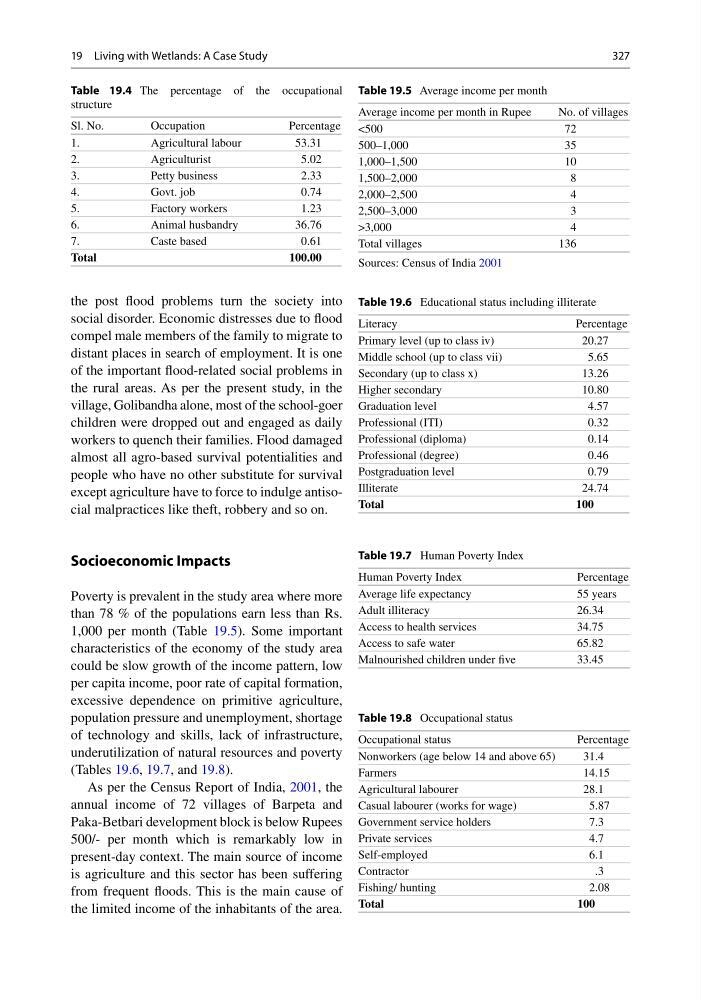
Poverty is prevalent in the study area where more
than 78 % of the populations earn less than Rs.
1,000 per month (Table 19.5 ). Some important
characteristics of the economy of the study area
could be slow growth of the income pattern, low
per capita income, poor rate of capital formation,
excessive dependence on primitive agriculture,
population pressure and unemployment, shortage
of technology and skills, lack of infrastructure,
underutilization of natural resources and poverty
(Tables 19.6 , 19.7 , and 19.8 ).
As per the Census Report of India, 2001 , the
annual income of 72 villages of Barpeta and
Paka-Betbari development block is below Rupees
500/- per month which is remarkably low in
present- day context. The main source of income
is agriculture and this sector has been suffering
from frequent fl oods. This is the main cause of
the limited income of the inhabitants of the area.
Table 19.4 The percentage of the occupational
structure
Sl. No.
Occupation
Percentage
1.
Agricultural labour
53.31
2.
Agriculturist
5.02
3.
Petty business
2.33
4.
Govt. job
0.74
5.
Factory workers
1.23
6.
Animal husbandry
36.76
7.
Caste based
0.61
Total
100.00
Table 19.5 Average income per month
Average income per month in Rupee
No. of villages
<500
72
500–1,000
35
1,000–1,500
10
1,500–2,000
8
2,000–2,500
4
2,500–3,000
3
>3,000
4
Total villages
136
Sources: Census of India 2001
Table 19.6 Educational status including illiterate
Literacy
Percentage
Primary level (up to class iv)
20.27
Middle school (up to class vii)
5.65
Secondary (up to class x)
13.26
Higher secondary
10.80
Graduation level
4.57
Professional (ITI)
0.32
Professional (diploma)
0.14
Professional (degree)
0.46
Postgraduation level
0.79
Illiterate
24.74
Total
100
Table 19.7 Human Poverty Index
Human Poverty Index
Percentage
Average life expectancy
55 years
Adult illiteracy
26.34
Access to health services
34.75
Access to safe water
65.82
Malnourished children under fi ve
33.45
Table 19.8 Occupational status
Occupational status
Percentage
Nonworkers (age below 14 and above 65)
31.4
Farmers
14.15
Agricultural labourer
28.1
Casual labourer (works for wage)
5.87
Government service holders
7.3
Private services
4.7
Self-employed
6.1
Contractor
.3
Fishing/ hunting
2.08
Total
100
19 Living with Wetlands: A Case Study
the post fl ood problems turn the society into
social disorder. Economic distresses due to fl ood
compel male members of the family to migrate to
distant places in search of employment. It is one
of the important fl ood-related social problems in
the rural areas. As per the present study, in the
village, Golibandha alone, most of the school- goer
children were dropped out and engaged as daily
workers to quench their families. Flood damaged
almost all agro-based survival potentialities and
people who have no other substitute for survival
except agriculture have to force to indulge antisocial malpractices like theft, robbery and so on.
Socioeconomic Impacts
Poverty is prevalent in the study area where more
than 78 % of the populations earn less than Rs.
1,000 per month (Table 19.5 ). Some important
characteristics of the economy of the study area
could be slow growth of the income pattern, low
per capita income, poor rate of capital formation,
excessive dependence on primitive agriculture,
population pressure and unemployment, shortage
of technology and skills, lack of infrastructure,
underutilization of natural resources and poverty
(Tables 19.6 , 19.7 , and 19.8 ).
As per the Census Report of India, 2001 , the
annual income of 72 villages of Barpeta and
Paka-Betbari development block is below Rupees
500/- per month which is remarkably low in
present- day context. The main source of income
is agriculture and this sector has been suffering
from frequent fl oods. This is the main cause of
the limited income of the inhabitants of the area.
Table 19.4 The percentage of the occupational
structure
Sl. No.
Occupation
Percentage
1.
Agricultural labour
53.31
2.
Agriculturist
5.02
3.
Petty business
2.33
4.
Govt. job
0.74
5.
Factory workers
1.23
6.
Animal husbandry
36.76
7.
Caste based
0.61
Total
100.00
Table 19.5 Average income per month
Average income per month in Rupee
No. of villages
<500
72
500–1,000
35
1,000–1,500
10
1,500–2,000
8
2,000–2,500
4
2,500–3,000
3
>3,000
4
Total villages
136
Sources: Census of India 2001
Table 19.6 Educational status including illiterate
Literacy
Percentage
Primary level (up to class iv)
20.27
Middle school (up to class vii)
5.65
Secondary (up to class x)
13.26
Higher secondary
10.80
Graduation level
4.57
Professional (ITI)
0.32
Professional (diploma)
0.14
Professional (degree)
0.46
Postgraduation level
0.79
Illiterate
24.74
Total
100
Table 19.7 Human Poverty Index
Human Poverty Index
Percentage
Average life expectancy
55 years
Adult illiteracy
26.34
Access to health services
34.75
Access to safe water
65.82
Malnourished children under fi ve
33.45
Table 19.8 Occupational status
Occupational status
Percentage
Nonworkers (age below 14 and above 65)
31.4
Farmers
14.15
Agricultural labourer
28.1
Casual labourer (works for wage)
5.87
Government service holders
7.3
Private services
4.7
Self-employed
6.1
Contractor
.3
Fishing/ hunting
2.08
Total
100
19 Living with Wetlands: A Case Study