

516
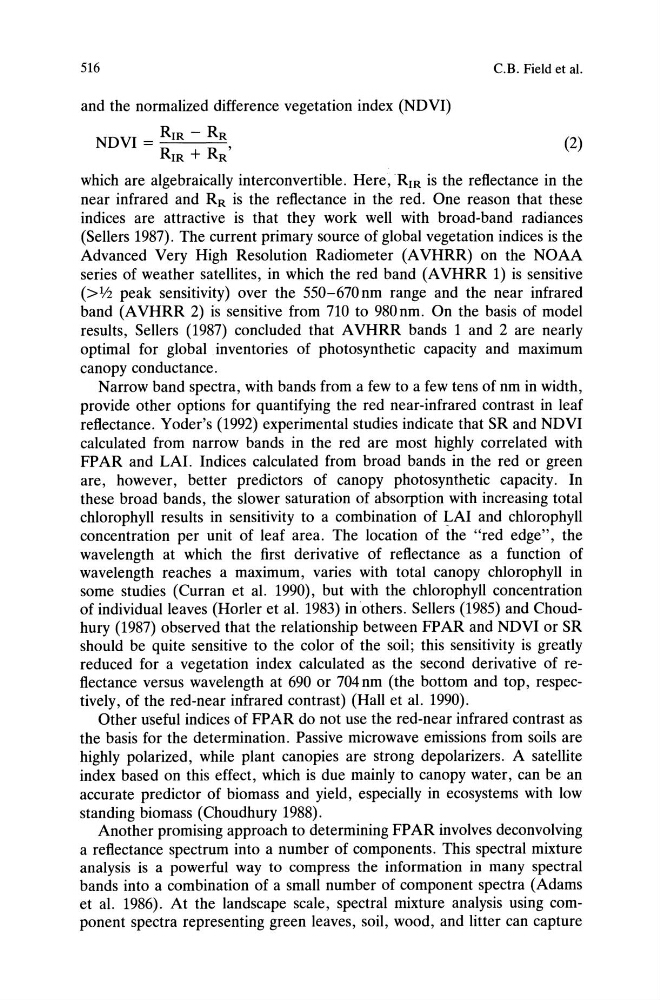
and the normalized difference vegetation index (NOVI)
NOVI = RIR - RR
RIR + RR'
C.B. Field et a1.
(2)
which are algebraically interconvertible. Here,R IR is the reflectance in the
near infrared and RR is the reflectance in the red. One reason that these
indices are attractive is that they work well with broad-band radiances
(Sellers 1987). The current primary source of global vegetation indices is the
Advanced Very High Resolution Radiometer (AVHRR) on the NOAA
series of weather satellites, in which the red band (AVHRR 1) is sensitive
(>1!2 peak sensitivity) over the 550-670 nm range and the near infrared
band (AVHRR 2) is sensitive from 710 to 980nm. On the basis of model
results, Sellers (1987) concluded that A VHRR bands 1 and 2 are nearly
optimal for global inventories of photosynthetic capacity and maximum
canopy conductance.
Narrow band spectra, with bands from a few to a few tens of nm in width,
provide other options for quantifying the red near-infrared contrast in leaf
reflectance. Yoder's (1992) experimental studies indicate that SR and NOVI
calculated from narrow bands in the red are most highly correlated with
FP AR and LA!. Indices calculated from broad bands in the red or green
are, however, better predictors of canopy photosynthetic capacity. In
these broad bands, the slower saturation of absorption with increasing total
chlorophyll results in sensitivity to a combination of ~AI and chlorophyll
concentration per unit of leaf area. The location of the "red edge", the
wavelength at which the first derivative of reflectance as a function of
wavelength reaches a maximum, varies with total canopy chlorophyll in
some studies (Curran et al. 1990), but with the chlorophyll concentration
of individual leaves (Horler et al. 1983) in others. Sellers (1985) and Choudhury (1987) observed that the relationship between FPAR and NOVI or SR
should be quite sensitive to the color of the soil; this sensitivity is greatly
reduced for a vegetation index calculated as the second derivative of reflectance versus wavelength at 690 or 704 nm (the bottom and top, respectively, of the red-near infrared contrast) (Hall et al. 1990).
Other useful indices of FP AR do not use the red-near infrared contrast as
the basis for the determination. Passive microwave emissions from soils are
highly polarized, while plant canopies are strong depolarizers. A satellite
index based on this effect, which is due mainly to canopy water, can be an
accurate predictor of biomass and yield, especially in ecosystems with low
standing biomass (Choudhury 1988).
Another promising approach to determining FP AR involves deconvolving
a reflectance spectrum into a number of components. This spectral mixture
analysis is a powerful way to compress the information in many spectral
bands into a combination of a small number of component spectra (Adams
et al. 1986). At the landscape scale, spectral mixture analysis using component spectra representing green leaves, soil, wood, and litter can capture
and the normalized difference vegetation index (NOVI)
NOVI = RIR - RR
RIR + RR'
C.B. Field et a1.
(2)
which are algebraically interconvertible. Here,R IR is the reflectance in the
near infrared and RR is the reflectance in the red. One reason that these
indices are attractive is that they work well with broad-band radiances
(Sellers 1987). The current primary source of global vegetation indices is the
Advanced Very High Resolution Radiometer (AVHRR) on the NOAA
series of weather satellites, in which the red band (AVHRR 1) is sensitive
(>1!2 peak sensitivity) over the 550-670 nm range and the near infrared
band (AVHRR 2) is sensitive from 710 to 980nm. On the basis of model
results, Sellers (1987) concluded that A VHRR bands 1 and 2 are nearly
optimal for global inventories of photosynthetic capacity and maximum
canopy conductance.
Narrow band spectra, with bands from a few to a few tens of nm in width,
provide other options for quantifying the red near-infrared contrast in leaf
reflectance. Yoder's (1992) experimental studies indicate that SR and NOVI
calculated from narrow bands in the red are most highly correlated with
FP AR and LA!. Indices calculated from broad bands in the red or green
are, however, better predictors of canopy photosynthetic capacity. In
these broad bands, the slower saturation of absorption with increasing total
chlorophyll results in sensitivity to a combination of ~AI and chlorophyll
concentration per unit of leaf area. The location of the "red edge", the
wavelength at which the first derivative of reflectance as a function of
wavelength reaches a maximum, varies with total canopy chlorophyll in
some studies (Curran et al. 1990), but with the chlorophyll concentration
of individual leaves (Horler et al. 1983) in others. Sellers (1985) and Choudhury (1987) observed that the relationship between FPAR and NOVI or SR
should be quite sensitive to the color of the soil; this sensitivity is greatly
reduced for a vegetation index calculated as the second derivative of reflectance versus wavelength at 690 or 704 nm (the bottom and top, respectively, of the red-near infrared contrast) (Hall et al. 1990).
Other useful indices of FP AR do not use the red-near infrared contrast as
the basis for the determination. Passive microwave emissions from soils are
highly polarized, while plant canopies are strong depolarizers. A satellite
index based on this effect, which is due mainly to canopy water, can be an
accurate predictor of biomass and yield, especially in ecosystems with low
standing biomass (Choudhury 1988).
Another promising approach to determining FP AR involves deconvolving
a reflectance spectrum into a number of components. This spectral mixture
analysis is a powerful way to compress the information in many spectral
bands into a combination of a small number of component spectra (Adams
et al. 1986). At the landscape scale, spectral mixture analysis using component spectra representing green leaves, soil, wood, and litter can capture