

514
Q)
()
C
n3
- ()
Q)
;;::
Q)
a:
0.3
0.2
0.1
. '
....
............
.'
.'
.'
.'
.'
.'
.'
,,'
,.'
.'
.'
.'
"
.'
....
.'
"
.,'
.'
.'
.'
........
C.B. Field et al.
.'
....................
... ~ ...... .
. ' ----•••••••
soil
.'
canopy
o.o~------~------~------~------~------~------~
400
500
600
700
800
900
1000
Wavelength (nm)
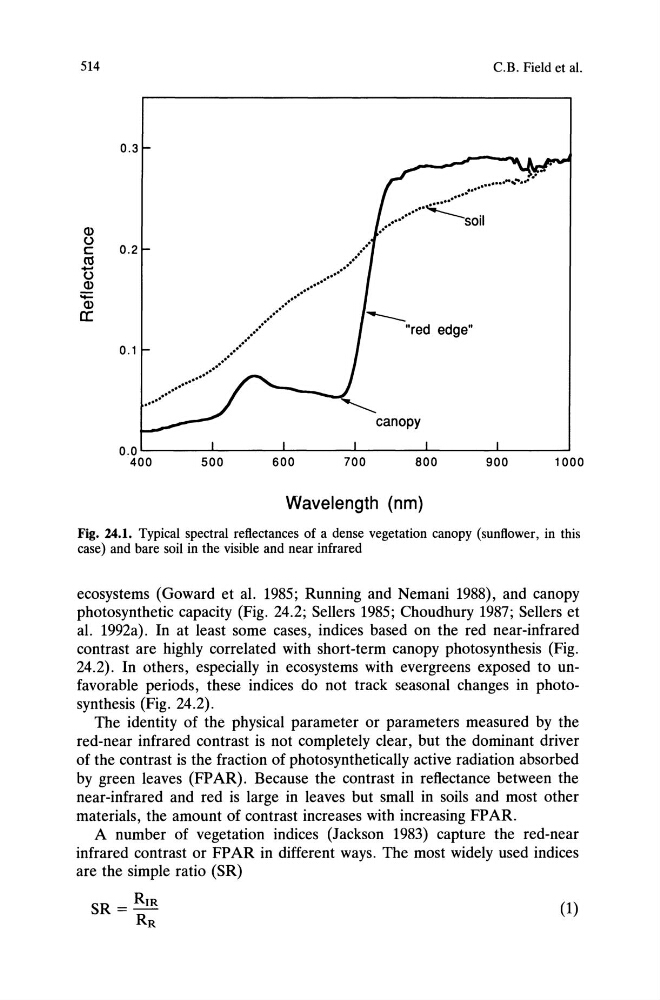
Fig. 24,1. Typical spectral reflectances of a dense vegetation canopy (sunflower, in this
case) and bare soil in the visible and near infrared
ecosystems (Goward et al. 1985; Running and Nemani 1988), and canopy
photosynthetic capacity (Fig. 24.2; Sellers 1985; Choudhury 1987; Sellers et
al. 1992a). In at least some cases, indices based on the red near-infrared
contrast are highly correlated with short-term canopy photosynthesis (Fig.
24.2). In others, especially in ecosystems with evergreens exposed to unfavorable periods, these indices do not track seasonal changes in photosynthesis (Fig. 24.2).
The identity of the physical parameter or parameters measured by the
red-near infrared contrast is not completely clear, but the dominant driver
of the contrast is the fraction of photosynthetically active radiation absorbed
by green leaves (FPAR). Because the contrast in reflectance between the
near-infrared and red is large in leaves but small in soils and most other
materials, the amount of contrast increases with increasing FP AR.
A number of vegetation indices (Jackson 1983) capture the red-near
infrared contrast or FP AR in different ways. The most widely used indices
are the simple ratio (SR)
SR = RIR
RR
(1)
Q)
()
C
n3
- ()
Q)
;;::
Q)
a:
0.3
0.2
0.1
. '
....
............
.'
.'
.'
.'
.'
.'
.'
,,'
,.'
.'
.'
.'
"
.'
....
.'
"
.,'
.'
.'
.'
........
C.B. Field et al.
.'
....................
... ~ ...... .
. ' ----•••••••
soil
.'
canopy
o.o~------~------~------~------~------~------~
400
500
600
700
800
900
1000
Wavelength (nm)
Fig. 24,1. Typical spectral reflectances of a dense vegetation canopy (sunflower, in this
case) and bare soil in the visible and near infrared
ecosystems (Goward et al. 1985; Running and Nemani 1988), and canopy
photosynthetic capacity (Fig. 24.2; Sellers 1985; Choudhury 1987; Sellers et
al. 1992a). In at least some cases, indices based on the red near-infrared
contrast are highly correlated with short-term canopy photosynthesis (Fig.
24.2). In others, especially in ecosystems with evergreens exposed to unfavorable periods, these indices do not track seasonal changes in photosynthesis (Fig. 24.2).
The identity of the physical parameter or parameters measured by the
red-near infrared contrast is not completely clear, but the dominant driver
of the contrast is the fraction of photosynthetically active radiation absorbed
by green leaves (FPAR). Because the contrast in reflectance between the
near-infrared and red is large in leaves but small in soils and most other
materials, the amount of contrast increases with increasing FP AR.
A number of vegetation indices (Jackson 1983) capture the red-near
infrared contrast or FP AR in different ways. The most widely used indices
are the simple ratio (SR)
SR = RIR
RR
(1)