

Effects of Phenology, Physiology, and Gradients in Community Composition
435
Whole-Canopy Model
Above..,anopy
Above-<:anopy
Above-eanopy
Above..,anopy
T
CI
Ael. Hum.
Wind Speed
+
Canopy Layer
Canopy Layer
Canopy Layer
Moss Physiology Model
Pnel. Transpiration
01
PFO
WIC
SST
ST10
• • • • •
1-· 1
Moss Layer
I
f-+I
Moss Layer
1 -
-.-1
Moss Layer
I .,.
,.
SST
1°
•
•
Pne t. Wat er/lux
Soli Resplnltlon Model
1 Asoil
Ecosystem Summation
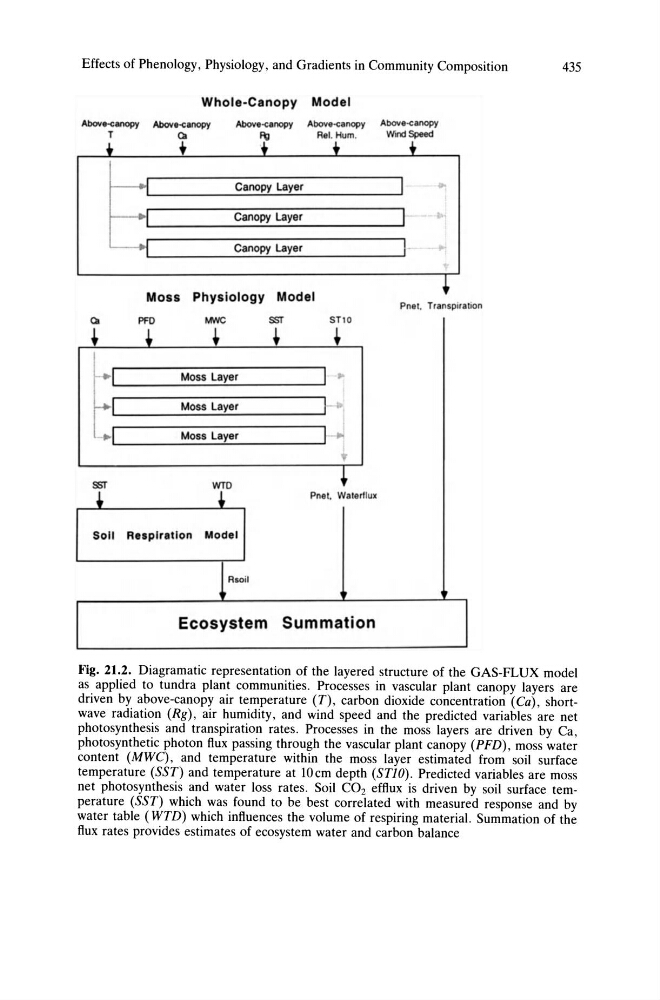
Fig. 21.2. Diagramatic representation of the layered structure of the GAS-FLUX model
as applied to tundra plant communities. Processes in vascular plant canopy layers are
driven by above-canopy air temperature (T), carbon dioxide concentration (Ca), shortwave radiation (Rg), air humidity, and wind speed and the predicted variables are net
photosynthesis and transpiration rates. Processes in the moss layers are driven by Ca,
photosynthetic photon flux passing through the vascular plant canopy (PFD), moss water
content (MWC), and temperature within the moss layer estimated from soil surface
temperature (SST) and temperature at 10 cm depth (STl 0). Predicted variables are moss
net photosynthesis and water loss rates. Soil CO2 efflux is driven by soil surface temperature (SST) which was found to be best correlated with measured response and by
water table (WTD) which influences the volume of respiring material. Summation of the
flux rates provides estimates of ecosystem water and carbon balance
435
Whole-Canopy Model
Above..,anopy
Above-<:anopy
Above-eanopy
Above..,anopy
T
CI
Ael. Hum.
Wind Speed
+
Canopy Layer
Canopy Layer
Canopy Layer
Moss Physiology Model
Pnel. Transpiration
01
PFO
WIC
SST
ST10
• • • • •
1-· 1
Moss Layer
I
f-+I
Moss Layer
1 -
-.-1
Moss Layer
I .,.
,.
SST
1°
•
•
Pne t. Wat er/lux
Soli Resplnltlon Model
1 Asoil
Ecosystem Summation
Fig. 21.2. Diagramatic representation of the layered structure of the GAS-FLUX model
as applied to tundra plant communities. Processes in vascular plant canopy layers are
driven by above-canopy air temperature (T), carbon dioxide concentration (Ca), shortwave radiation (Rg), air humidity, and wind speed and the predicted variables are net
photosynthesis and transpiration rates. Processes in the moss layers are driven by Ca,
photosynthetic photon flux passing through the vascular plant canopy (PFD), moss water
content (MWC), and temperature within the moss layer estimated from soil surface
temperature (SST) and temperature at 10 cm depth (STl 0). Predicted variables are moss
net photosynthesis and water loss rates. Soil CO2 efflux is driven by soil surface temperature (SST) which was found to be best correlated with measured response and by
water table (WTD) which influences the volume of respiring material. Summation of the
flux rates provides estimates of ecosystem water and carbon balance