

406
H. Ziegler
Table 19.4. o13e (0/00, PDB) and oD (0/00, SMOW) values of fungi and their host plants
(dry matter). All sample from surroundings of Munich
013e
8D
Pseudohydnum gelatinosum (Scop. ex Fr.) Karst.
-24.04
-43.7
Pinus sylvestris L.
-27.68
-87.4
Thelephora terrestris Pers. ex Fr.
-24.38
-70.7
Picea abies (L.) Karst.
-25.81
-81.8
Piptoporus betulinus (Bull ex Fr.) Karst.
-22.81
-45.4
Betula pendula Roth
-26.12
-130.7
Trametes abietina (Dicks. ex Fr.) Pilat
-25.68
-48.5
Picea abies (L.) Karst.
-21.79
-104.8
Trametes hirsuta (Wulfen ex fr.) Pilat
-22.26
-36.9
Fagus sylvatica L.
-25.91
-116.0
Trametes abietina (Dicks. ex Fr.) Pilat
-25.68
-48.5
Picea abies
-21.79
-104.8
Schizophyllum commune Fr.
-24.34
-41.0
Fagus sylvatica L.
-27.23
-108.3
Hypoxylonfragiforme (Pers. ex Fr.) Kickx.
-25.59
-84.4
Fagus sylvatica L.
-25.88
-119.5
Ustilago maydis (DC) Tul. (distorted leaves of mays)
-11.23
-39.4
Zea mays L. (leaves)
-11.56
-62.2
In galls (Table 19.1) there is a slightly higher 13C content than in the
parent tissues. This could be due to a relative lower content of lipids
(membranes) compared with cell wall material; lipids have a lower 13C
content (see Introduction).
Holoparasites (Table 19.2) have statistically identical 013C values with
their hosts, whether the hosts have CT , C4-, or CAM type photosynthesis.
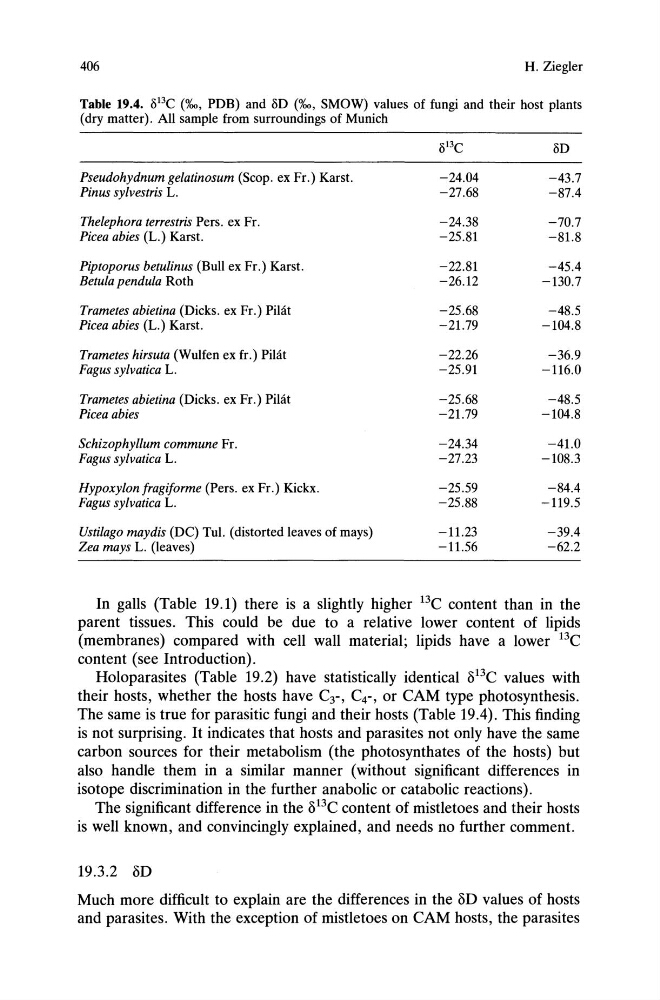
The same is true for parasitic fungi and their hosts (Table 19.4). This finding
is not surprising. It indicates that hosts and parasites not only have the same
carbon sources for their metabolism (the photosynthates of the hosts) but
also handle them in a similar manner (without significant differences in
isotope discrimination in the further anabolic or catabolic reactions).
The significant difference in the 013C content of mistletoes and their hosts
is well known, and convincingly explained, and needs no further comment.
19.3.2 oD
Much more difficult to explain are the differences in the oD values of hosts
and parasites. With the exception of mistletoes on CAM hosts, the parasites
H. Ziegler
Table 19.4. o13e (0/00, PDB) and oD (0/00, SMOW) values of fungi and their host plants
(dry matter). All sample from surroundings of Munich
013e
8D
Pseudohydnum gelatinosum (Scop. ex Fr.) Karst.
-24.04
-43.7
Pinus sylvestris L.
-27.68
-87.4
Thelephora terrestris Pers. ex Fr.
-24.38
-70.7
Picea abies (L.) Karst.
-25.81
-81.8
Piptoporus betulinus (Bull ex Fr.) Karst.
-22.81
-45.4
Betula pendula Roth
-26.12
-130.7
Trametes abietina (Dicks. ex Fr.) Pilat
-25.68
-48.5
Picea abies (L.) Karst.
-21.79
-104.8
Trametes hirsuta (Wulfen ex fr.) Pilat
-22.26
-36.9
Fagus sylvatica L.
-25.91
-116.0
Trametes abietina (Dicks. ex Fr.) Pilat
-25.68
-48.5
Picea abies
-21.79
-104.8
Schizophyllum commune Fr.
-24.34
-41.0
Fagus sylvatica L.
-27.23
-108.3
Hypoxylonfragiforme (Pers. ex Fr.) Kickx.
-25.59
-84.4
Fagus sylvatica L.
-25.88
-119.5
Ustilago maydis (DC) Tul. (distorted leaves of mays)
-11.23
-39.4
Zea mays L. (leaves)
-11.56
-62.2
In galls (Table 19.1) there is a slightly higher 13C content than in the
parent tissues. This could be due to a relative lower content of lipids
(membranes) compared with cell wall material; lipids have a lower 13C
content (see Introduction).
Holoparasites (Table 19.2) have statistically identical 013C values with
their hosts, whether the hosts have CT , C4-, or CAM type photosynthesis.
The same is true for parasitic fungi and their hosts (Table 19.4). This finding
is not surprising. It indicates that hosts and parasites not only have the same
carbon sources for their metabolism (the photosynthates of the hosts) but
also handle them in a similar manner (without significant differences in
isotope discrimination in the further anabolic or catabolic reactions).
The significant difference in the 013C content of mistletoes and their hosts
is well known, and convincingly explained, and needs no further comment.
19.3.2 oD
Much more difficult to explain are the differences in the oD values of hosts
and parasites. With the exception of mistletoes on CAM hosts, the parasites