

18
O. Bjorkman and B. Demmig-Adams
2.2 The Concept of Excess Photon Flux Density
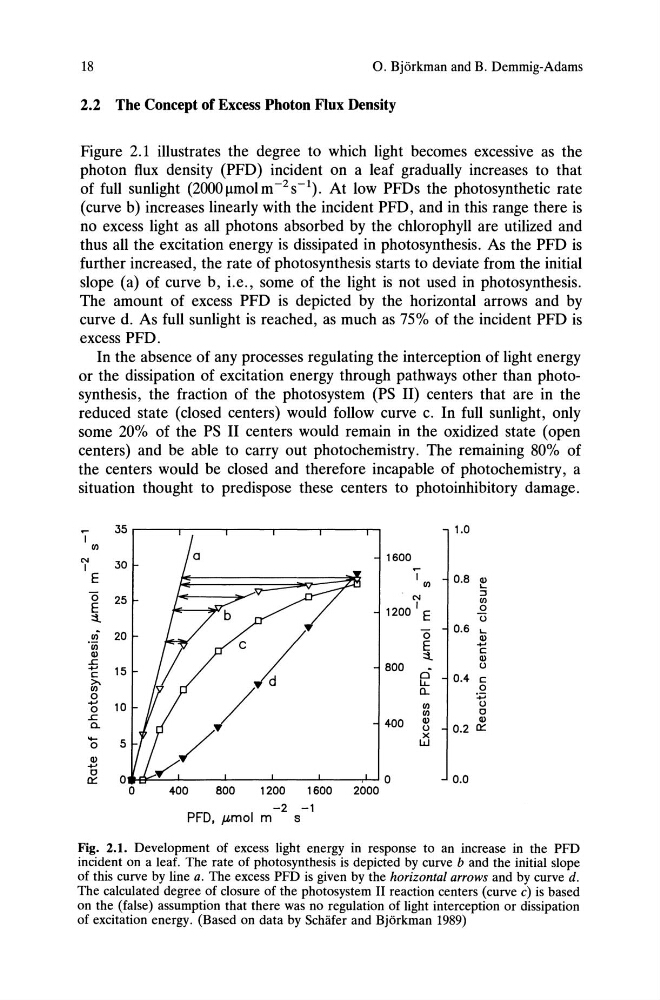
Figure 2.1 illustrates the degree to which light becomes excessive as the
photon flux density (PFD) incident on a leaf gradually increases to that
of full sunlight (2000 Ilmol m - 2 S -1). At low PFDs the photosynthetic rate
(curve b) increases linearly with the incident PFD, and in this range there is
no excess light as all photons absorbed by the chlorophyll are utilized and
thus all the excitation energy is dissipated in photosynthesis. As the PFD is
further increased, the rate of photosynthesis starts to deviate from the initial
slope (a) of curve b, i.e., some of the light is not used in photosynthesis.
The amount of excess PFD is depicted by the horizontal arrows and by
curve d. As full sunlight is reached, as much as 75% of the incident PFD is
excess PFD.
In the absence of any processes regulating the interception of light energy
or the dissipation of excitation energy through pathways other than photosynthesis, the fraction of the photosystem (PS II) centers that are in the
reduced state (closed centers) would follow curve c. In full sunlight, only
some 20% of the PS II centers would remain in the oxidized state (open
centers) and be able to carry out photochemistry. The remaining 80% of
the centers would be closed and therefore incapable of photochemistry, a
situation thought to predispose these centers to photoinhibitory damage.
~
35
1.0
I Ul
'"
30
1600
I E
I
0.8 C1l
Ul
L.
0
'"
::J
25
Ul
E
1200 I E
0
::t
ti
20
'0
0.6 L.
Ul
C1l
'iii
E
.... c
C1l
::t
C1l
..c
.... 15
800 0"
()
c
0.4
>.
I.J..
c
Ul
0..
0
0
:;:;
.... 10
Ul
()
0
Ul
0
..c
400 C1l
C1l
a.
()
0.2 t:t:
....
x
0
5
w
C1l
.... 0 0
0
0.0
t:t:
0
400
800
1200
1600
2000
-2 -1
PFD. ).I-mo\ m
s
Fig. 2.1. Development of excess light energy in response to an increase in the PFD
incident on a leaf. The rate of photosynthesis is depicted by curve b and the initial slope
of this curve by line a. The excess PFD is given by the horizontal arrows and by curve d.
The calculated degree of closure of the photosystem II reaction centers (curve c) is based
on the (false) assumption that there was no regulation of light interception or dissipation
of excitation energy. (Based on data by Schafer and Bjorkman 1989)
O. Bjorkman and B. Demmig-Adams
2.2 The Concept of Excess Photon Flux Density
Figure 2.1 illustrates the degree to which light becomes excessive as the
photon flux density (PFD) incident on a leaf gradually increases to that
of full sunlight (2000 Ilmol m - 2 S -1). At low PFDs the photosynthetic rate
(curve b) increases linearly with the incident PFD, and in this range there is
no excess light as all photons absorbed by the chlorophyll are utilized and
thus all the excitation energy is dissipated in photosynthesis. As the PFD is
further increased, the rate of photosynthesis starts to deviate from the initial
slope (a) of curve b, i.e., some of the light is not used in photosynthesis.
The amount of excess PFD is depicted by the horizontal arrows and by
curve d. As full sunlight is reached, as much as 75% of the incident PFD is
excess PFD.
In the absence of any processes regulating the interception of light energy
or the dissipation of excitation energy through pathways other than photosynthesis, the fraction of the photosystem (PS II) centers that are in the
reduced state (closed centers) would follow curve c. In full sunlight, only
some 20% of the PS II centers would remain in the oxidized state (open
centers) and be able to carry out photochemistry. The remaining 80% of
the centers would be closed and therefore incapable of photochemistry, a
situation thought to predispose these centers to photoinhibitory damage.
~
35
1.0
I Ul
'"
30
1600
I E
I
0.8 C1l
Ul
L.
0
'"
::J
25
Ul
E
1200 I E
0
::t
ti
20
'0
0.6 L.
Ul
C1l
'iii
E
.... c
C1l
::t
C1l
..c
.... 15
800 0"
()
c
0.4
>.
I.J..
c
Ul
0..
0
0
:;:;
.... 10
Ul
()
0
Ul
0
..c
400 C1l
C1l
a.
()
0.2 t:t:
....
x
0
5
w
C1l
.... 0 0
0
0.0
t:t:
0
400
800
1200
1600
2000
-2 -1
PFD. ).I-mo\ m
s
Fig. 2.1. Development of excess light energy in response to an increase in the PFD
incident on a leaf. The rate of photosynthesis is depicted by curve b and the initial slope
of this curve by line a. The excess PFD is given by the horizontal arrows and by curve d.
The calculated degree of closure of the photosystem II reaction centers (curve c) is based
on the (false) assumption that there was no regulation of light interception or dissipation
of excitation energy. (Based on data by Schafer and Bjorkman 1989)