

370
J. R. Ehleringer
o Phoenix
• Needles
U
0 Indio
3
C
0
oro
:.=
•
CO
o· .~ o .~
.S>
2
0
cSJ
CD
• 0 0 o ~
"'C
~
"'C
~D •
....
CO
o 0 en
"'C
c
o •
CO
....
CJ)
0 10
20
30
40
50
Mean monthly temperature, C
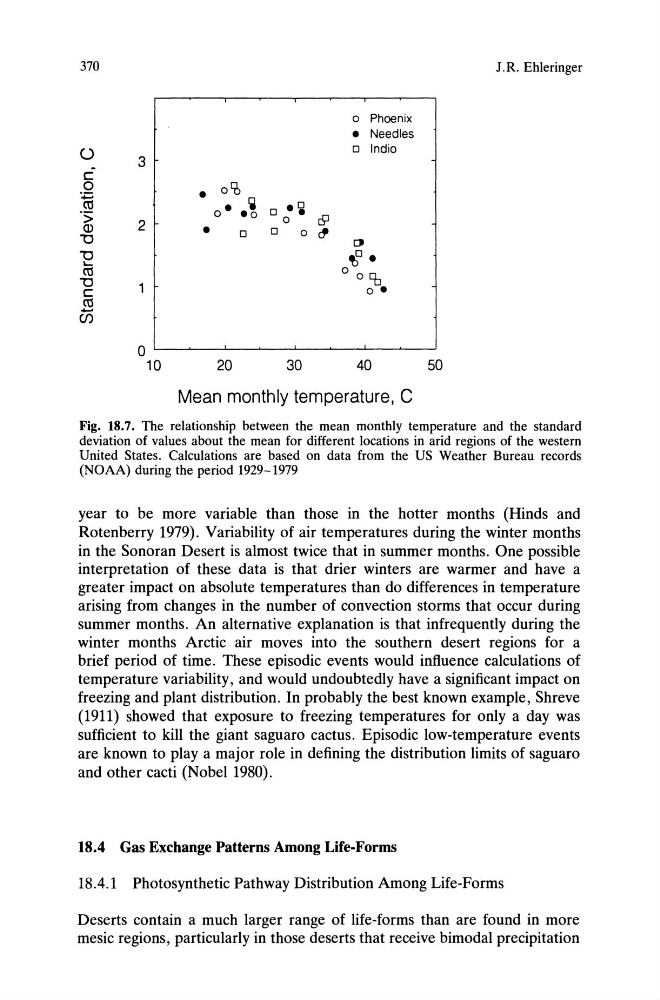
Fig. 18.7. The relationship between the mean monthly temperature and the standard
deviation of values about the mean for different locations in arid regions of the western
United States. Calculations are based on data from the US Weather Bureau records
(NOAA) during the period 1929-1979
year to be more variable than those in the hotter months (Hinds and
Rotenberry 1979). Variability of air temperatures during the winter months
in the Sonoran Desert is almost twice that in summer months. One possible
interpretation of these data is that drier winters are warmer and have a
greater impact on absolute temperatures than do differences in temperature
arising from changes in the number of convection storms that occur during
summer months. An alternative explanation is that infrequently during the
winter months Arctic air moves into the southern desert regions for a
brief period of time. These episodic events would influence calculations of
temperature variability, and would undoubtedly have a significant impact on
freezing and plant distribution. In probably the best known example, Shreve
(1911) showed that exposure to freezing temperatures for only a day was
sufficient to kill the giant saguaro cactus. Episodic low-temperature events
are known to playa major role in defining the distribution limits of saguaro
and other cacti (Nobel 1980).
18.4 Gas Exchange Patterns Among Life-Forms
18.4.1 Photosynthetic Pathway Distribution Among Life-Forms
Deserts contain a much larger range of life-forms than are found in more
mesic regions, particularly in those deserts that receive bimodal precipitation
J. R. Ehleringer
o Phoenix
• Needles
U
0 Indio
3
C
0
oro
:.=
•
CO
o· .~ o .~
.S>
2
0
cSJ
CD
• 0 0 o ~
"'C
~
"'C
~D •
....
CO
o 0 en
"'C
c
o •
CO
....
CJ)
0 10
20
30
40
50
Mean monthly temperature, C
Fig. 18.7. The relationship between the mean monthly temperature and the standard
deviation of values about the mean for different locations in arid regions of the western
United States. Calculations are based on data from the US Weather Bureau records
(NOAA) during the period 1929-1979
year to be more variable than those in the hotter months (Hinds and
Rotenberry 1979). Variability of air temperatures during the winter months
in the Sonoran Desert is almost twice that in summer months. One possible
interpretation of these data is that drier winters are warmer and have a
greater impact on absolute temperatures than do differences in temperature
arising from changes in the number of convection storms that occur during
summer months. An alternative explanation is that infrequently during the
winter months Arctic air moves into the southern desert regions for a
brief period of time. These episodic events would influence calculations of
temperature variability, and would undoubtedly have a significant impact on
freezing and plant distribution. In probably the best known example, Shreve
(1911) showed that exposure to freezing temperatures for only a day was
sufficient to kill the giant saguaro cactus. Episodic low-temperature events
are known to playa major role in defining the distribution limits of saguaro
and other cacti (Nobel 1980).
18.4 Gas Exchange Patterns Among Life-Forms
18.4.1 Photosynthetic Pathway Distribution Among Life-Forms
Deserts contain a much larger range of life-forms than are found in more
mesic regions, particularly in those deserts that receive bimodal precipitation