

Variation in Gas Exchange Characteristics Among Desert Plants
c
0
.<5
.~
>
0
C
OJ
.~
~
0
0
2.0 r-----.-~----,-~-,-I
1.5
1.0
0.5
0.0 0
0
0
0
0
Om
••
"
•
. ~ <1: •
0
100
200
• winter
o summer
•
o
300
Mean seasonal precipitation, mm
365
50/50 winter/summer rain
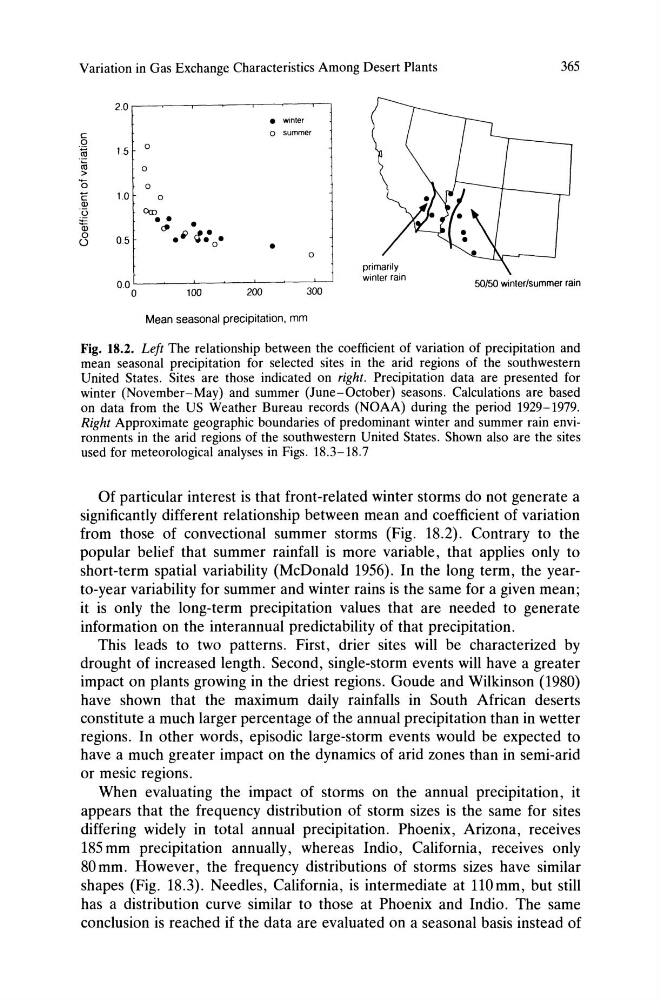
Fig. 18.2. Left The relationship between the coefficient of variation of precipitation and
mean seasonal precipitation for selected sites in the arid regions of the southwestern
United States. Sites are those indicated on right. Precipitation data are presented for
winter (November-May) and summer (June-October) seasons. Calculations are based
on data from the US Weather Bureau records (NOAA) during the period 1929-1979.
Right Approximate geographic boundaries of predominant winter and summer rain environments in the arid regions of the southwestern United States. Shown also are the sites
used for meteorological analyses in Figs. 18.3-18.7
Of particular interest is that front-related winter storms do not generate a
significantly different relationship between mean and coefficient of variation
from those of convectional summer storms (Fig. 18.2). Contrary to the
popular belief that summer rainfall is more variable, that applies only to
short-term spatial variability (McDonald 1956). In the long term, the yearto-year variability for summer and winter rains is the same for a given mean;
it is only the long-term precipitation values that are needed to generate
information on the interannual predictability of that precipitation.
This leads to two patterns. First, drier sites will be characterized by
drought of increased length. Second, single-storm events will have a greater
impact on plants growing in the driest regions. Goude and Wilkinson (1980)
have shown that the maximum daily rainfalls in South African deserts
constitute a much larger percentage of the annual precipitation than in wetter
regions. In other words, episodic large-storm events would be expected to
have a much greater impact on the dynamics of arid zones than in semi-arid
or mesic regions.
When evaluating the impact of storms on the annual precipitation, it
appears that the frequency distribution of storm sizes is the same for sites
differing widely in total annual precipitation. Phoenix, Arizona, receives
185 mm precipitation annually, whereas Indio, California, receives only
80 mm. However, the frequency distributions of storms sizes have similar
shapes (Fig. 18.3). Needles, California, is intermediate at 110 mm, but still
has a distribution curve similar to those at Phoenix and Indio. The same
conclusion is reached if the data are evaluated on a seasonal basis instead of
c
0
.<5
.~
>
0
C
OJ
.~
~
0
0
2.0 r-----.-~----,-~-,-I
1.5
1.0
0.5
0.0 0
0
0
0
0
Om
••
"
•
. ~ <1: •
0
100
200
• winter
o summer
•
o
300
Mean seasonal precipitation, mm
365
50/50 winter/summer rain
Fig. 18.2. Left The relationship between the coefficient of variation of precipitation and
mean seasonal precipitation for selected sites in the arid regions of the southwestern
United States. Sites are those indicated on right. Precipitation data are presented for
winter (November-May) and summer (June-October) seasons. Calculations are based
on data from the US Weather Bureau records (NOAA) during the period 1929-1979.
Right Approximate geographic boundaries of predominant winter and summer rain environments in the arid regions of the southwestern United States. Shown also are the sites
used for meteorological analyses in Figs. 18.3-18.7
Of particular interest is that front-related winter storms do not generate a
significantly different relationship between mean and coefficient of variation
from those of convectional summer storms (Fig. 18.2). Contrary to the
popular belief that summer rainfall is more variable, that applies only to
short-term spatial variability (McDonald 1956). In the long term, the yearto-year variability for summer and winter rains is the same for a given mean;
it is only the long-term precipitation values that are needed to generate
information on the interannual predictability of that precipitation.
This leads to two patterns. First, drier sites will be characterized by
drought of increased length. Second, single-storm events will have a greater
impact on plants growing in the driest regions. Goude and Wilkinson (1980)
have shown that the maximum daily rainfalls in South African deserts
constitute a much larger percentage of the annual precipitation than in wetter
regions. In other words, episodic large-storm events would be expected to
have a much greater impact on the dynamics of arid zones than in semi-arid
or mesic regions.
When evaluating the impact of storms on the annual precipitation, it
appears that the frequency distribution of storm sizes is the same for sites
differing widely in total annual precipitation. Phoenix, Arizona, receives
185 mm precipitation annually, whereas Indio, California, receives only
80 mm. However, the frequency distributions of storms sizes have similar
shapes (Fig. 18.3). Needles, California, is intermediate at 110 mm, but still
has a distribution curve similar to those at Phoenix and Indio. The same
conclusion is reached if the data are evaluated on a seasonal basis instead of